
Following futures positions of non-commercials are as of May 30, 2017.
10-year note: Currently net long 258.2k, down 104.3k.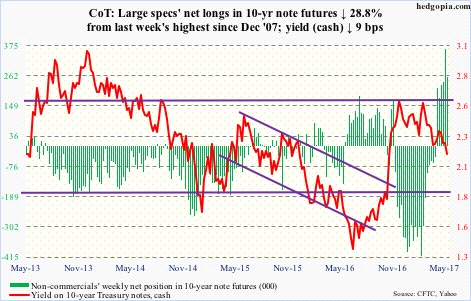
“If the tension between the progress on employment and the lack of progress on inflation persists, it may lead me to reassess the expected path of the federal funds rate in the future, although it is premature to make that call today.”
The quote is from a speech Lael Brainard, Fed governor, gave on Tuesday. It was titled “Navigating the Different Signals from Inflation and Unemployment.”
In the current cycle, of the Fed’s dual mandate – maximum employment and price stability – the former has seen progress. The unemployment rate in May was 4.3 percent – matching the low of 16 years ago.
Consumer inflation, on the other hand, is subdued. Particularly the one favored by the Fed. Core CPI rose 1.9 percent year-over-year in April, and that was the first time since October 2015 inflation grew sub-two percent. Core PCE – the Fed’s favorite measure – has been coming in lower than core CPI, and has not grown north of two percent since April 2012; this April, it rose 1.54 percent.
Ms. Brainard has a point – that inflation is missing in action. But only if we limit ourselves to core PCE. Inflation is evident elsewhere. Plenty of it. Particularly in assets – ranging from stocks to real estate to the arts.
The Fed is between a rock and a hard place. The title of her speech says as much. Which one of the two variables should the FOMC give more weight to?
This much we know. The more they focus on inflation, the higher the odds the easy monetary policy continues, and with it would have risen risks of excesses.
30-year bond: Currently net long 21k, down 26.3k.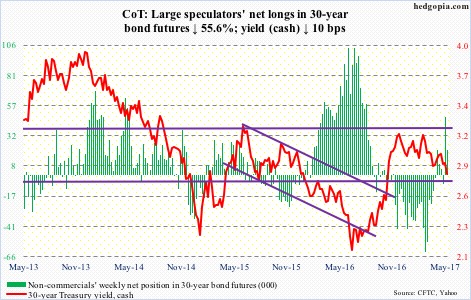
Major economic releases next week are as follows.
Monday brings productivity (1Q17, revised), durable goods (April, revised), and the ISM non-manufacturing index (May).
Preliminarily, non-farm business output per hour declined at a 0.6 percent annual rate in 1Q17, reversing growth in prior two quarters. This was the fourth quarterly decline in productivity in the last six quarters.
Orders for non-defense capital goods ex-aircraft – proxy for business capital expenditures – rose 2.9 percent y/y in April to $62.9 billion. This was the fourth up month in last five, following 25 consecutive months of y/y contraction. Orders peaked in September 2014 at a seasonally adjusted annual rate of $70.3 billion.
Non-manufacturing activity rose 2.3 points month-over-month in April to 57.5. Similarly, services orders increased 3.3 points m/m to 63.2 – the highest since 65.3 in August 2005.
JOLTS for April is reported on Tuesday. Non-farm job openings were up 61,000 m/m in March to 5.74 million. Openings peaked last July at 5.97 million – essentially on par with 5.89 million in July 2015 and 5.85 million in March 2016.
Crude oil: Currently net long 434.8k, up 23k.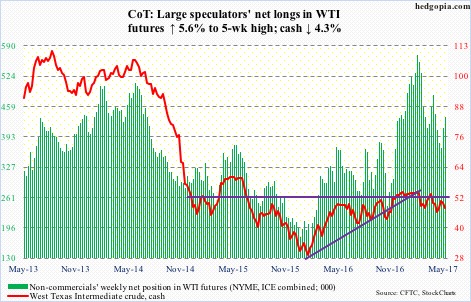
In the EIA report out Wednesday, positives outweighed negatives, but this was no help to spot West Texas Intermediate crude. It fell 2.7 percent in that session – rejected at the 200-day moving average.
Having rallied big into last week’s decision by OPEC/non-OPEC to extend the existing production cutback agreement by another nine months until 1Q18, oil suffered a classic ‘buy the rumor, sell the news’ phenomenon.
Friday was down 1.5 percent, but support at $47 was tested and held – a must-save for near-term momentum.
For the week ended May 26, stocks of crude fell 6.4 million barrels to 509.9 million barrels – now down 25.6 million barrels from record high 535.5 million barrels eight weeks ago.
Gasoline inventory fell, too – down 2.9 million barrels to 237 million barrels. As did crude imports, which fell 309,000 barrels per day to 7.99 million b/d.
Refinery utilization expanded 1.5 percentage points to 95 percent – the highest since August 2015. Although the path of least resistance from these levels is down.
Production continued to rise – up 22,000 b/d to 9.34 mb/d. Since OPEC reached a cutback agreement late November last year, U.S. crude production has increased by 643,000 b/d.
Distillate stocks rose 394,000 barrels to 146.7 million barrels.
E-mini S&P 500: Currently net long 56.1k, up 15.7k.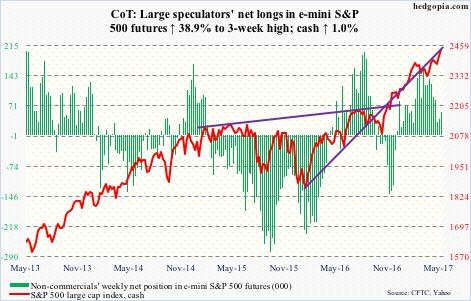
Yet another week and yet another breakout on the cash. The number to beat now is 2440.23. The 10-day moving average has hooked up. The 50-day which earlier seemed to be wanting to flatten out is slightly rising.
On Wednesday, bulls defended last week’s break out of 2400. The next time the index comes under pressure, this is where a bull-bear tug of war will be fought.
This week, flows sided with the bulls. In the week to Wednesday, SPY, the SPDR S&P 500 ETF, took in $4.9 billion, reversing $10.2 billion in outflows in the prior four (courtesy of ETF.com).
In the same week, $9.2 billion moved into U.S.-based equity funds, once again reversing outflows in the prior four during which $17.1 billion was withdrawn (courtesy of Lipper).
Euro: Currently net long 72.9k, up 8k.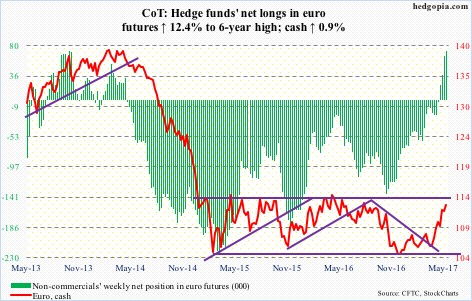
Early this week, Mario Draghi, ECB president, said the Eurozone still needs an “extraordinary amount of monetary support.” The bank still buys €60 billion in bonds every month (beginning April), down from €80 billion.
Particularly this year, the Eurozone economy is churning out good numbers. The euro (cash) responded with a nearly nine percent rally between January 3 and May 22 this year.
There are no signs the Eurozone QE is getting dialed down anytime soon.
Despite this, bulls are not ready to give up on the currency. In the past couple of weeks, it was sideways to slightly up, but rallied 0.6 percent on Friday. May’s disappointing U.S. jobs report helped the euro.
Gold: Currently net long 167.1k, up 7.3k.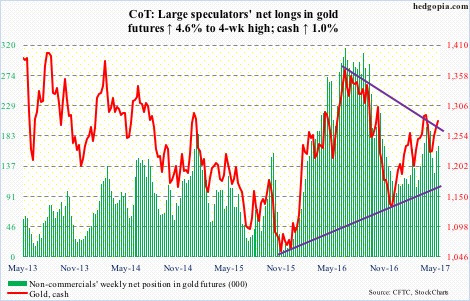
Friday, the cash poked its head out of a falling trend line from last July. This is potentially important, although it is not a clean breakout yet.
Gold ($1,280.2) has remained trapped between that trend line and a rising one from last December. This is perhaps why traders/investors have been on the sidelines.
In the week ended Wednesday, GLD, the SPDR gold ETF, saw no activity whatsoever. This was the second such week in the last three (courtesy of ETF.com).
The daily chart is overbought. And there is support underneath, with the 50-day at $1,257.31 and the 200-day at $1,245.92.
Nasdaq 100 index (mini): Currently net long 80.3k, up 6.2k.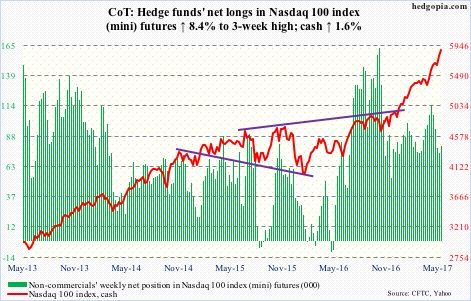
In the week ended Wednesday, QQQ, the PowerShares Nasdaq 100 ETF, attracted another $523 million. This followed inflows of $394 million in the prior week (courtesy of ETF.com).
As overbought as the cash is on nearly all time frames, momentum is yet to break, with both 10- and 20-day on the rise. As is – not surprisingly – the 50-day.
The index is up 21 percent year-to-date!
Russell 2000 mini-index: Currently net short 73k, up 529.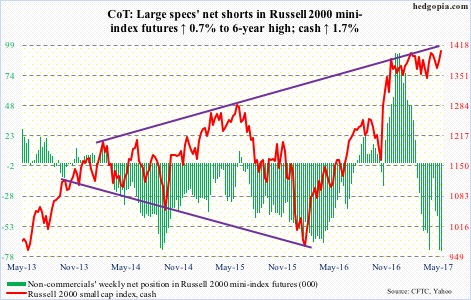
The cash (1405.39) witnessed a huge reversal on Wednesday, rallying intraday from 1354.85 to the Friday high of 1414.96 – a 4.4-percent swing. Non-commercials probably got squeezed. That said, it is too soon to say if this is a reversal the bulls can count on.
For six months now, the Russell 2000 has remained trapped between 1390s and 1340s, with a couple of false breakouts.
For a change, IWM, the iShares Russell 2000 ETF, saw inflows. In the week ended Wednesday, $151 million came in. In the prior three, $4.3 billion was redeemed (courtesy of ETF.com). Nonetheless, $14 million came out on Thursday when the ETF jumped 1.9 percent.
US Dollar Index: Currently net long 27.7k, down 3.6k.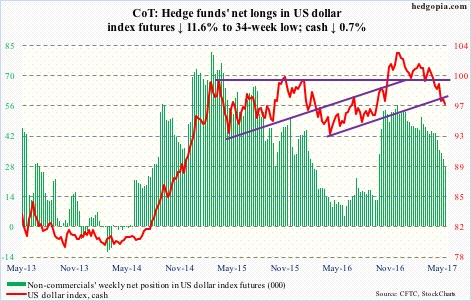
The cash (96.67) is more or less sideways the past couple of weeks, with the 10-day having resisted rally attempts the past five sessions.
From the intraday high on January 3, the dollar index has dropped nearly seven percent this year. The Friday low approximated the bottom of a five-month downward-sloping channel. Bulls hope this holds.
Resistance above is plentiful. The 50-day lies at 99 and the 200-day at 99.19.
Non-commercials continue to show disinterest, having cut net longs to a 34-week low.
VIX: Currently net short 118.9k, up 16.5k.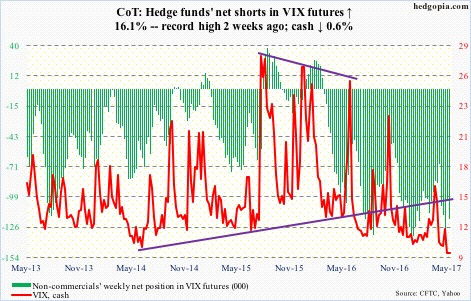
Spot VIX started June by closing below 10 on Thursday, and stayed there on Friday. In its 27-year history, this was only the 15th time this occurred, four of which took place in May.
Shorter-term moving averages are resisting rally attempts. They need to at least go sideways.
Along the same lines, the VIX-to-VXV ratio closed in high .70s – very subdued historically – for the second straight week.
The price of protection is cheap.
