
Following futures positions of non-commercials are as of April 25, 2023.
10-year note: Currently net short 740.3k, up 60.2k.
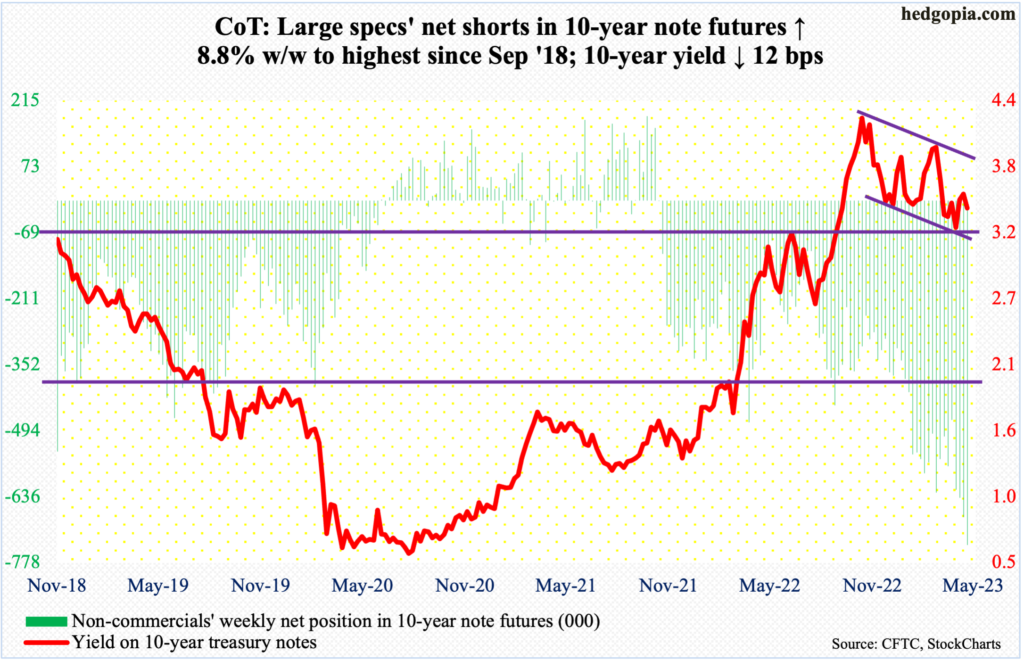
The FOMC meets next week. A 25-basis-point hike is baked in. In the futures market, traders have assigned an 84 percent probability to a raise. With this, the fed funds rate will have risen to a range of 500 basis points to 525 basis points.
After this, markets expect the Federal Reserve to stop the tightening cycle the central bank began a year ago. In March last year, the benchmark rates were languishing between zero and 25 basis points. The March-meeting dot plot, too, expects a terminal rate of 5.1 percent. Where the Fed and the markets differ is how the cycle evolves from here.
Futures traders believe the Fed will begin to lower rates as soon as either September or November, ending the year between 450 basis points and 475 basis points. FOMC officials, however, see the world differently.
Firstly, it is entirely possible that on Wednesday the FOMC does not signal an end to the tightening cycle, instead emphasizing its date dependency, which will mean the upcoming CPI and PCE releases will decide if there will be another hike in June. This development will be market-unfriendly.
Secondly, even if the FOMC were to telegraph a pause after next week’s meeting, they will in no way go along with markets’ demands for two 25-basis-point cuts by year-end. Given where inflation is versus their two percent goal, they have been stating for a while that they would like to leave the rates higher for longer. Odds favor Fed Chair Jerome Powell will repeat this sentiment next week. This, too, should come as a surprise to particularly equity bulls that are desperately positioned for a pivot.
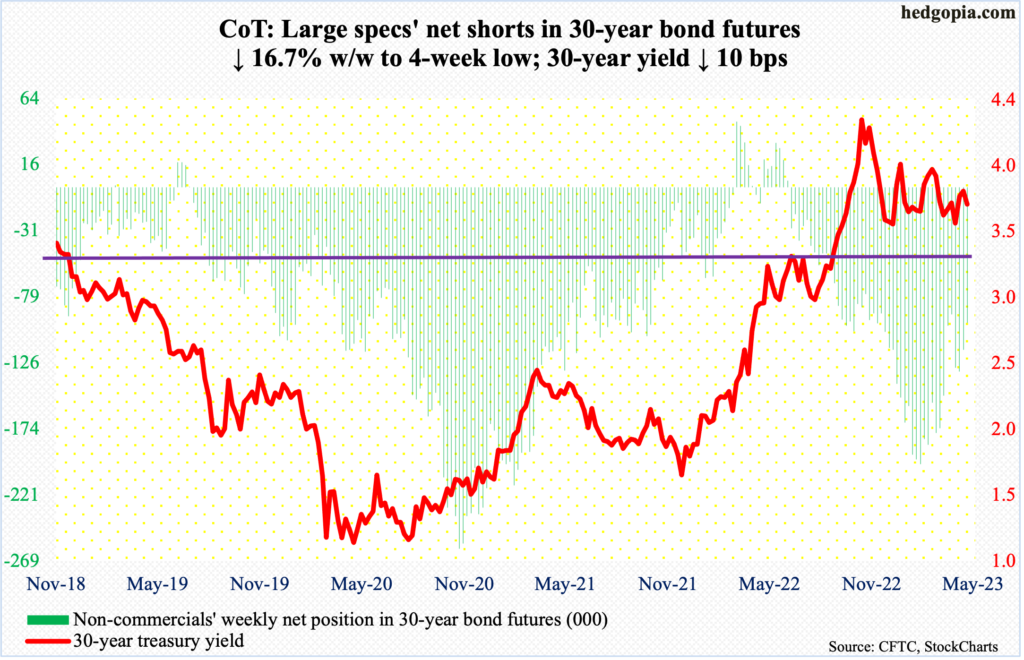
30-year bond: Currently net short 97.4k, down 19.6k.
Major economic releases for next week are as follows.
The ISM manufacturing index (April) comes out on Monday. Manufacturing activity in March declined 1.3 percentage points month-over-month to 46.3 percent. This was the fifth month in a row the index remained sub-50.
On Tuesday, job openings (JOLTS, March) and factory orders (March) are on dock.
February non-farm job openings decreased 632,000 m/m to 9.9 million. The series peaked at 12 million in March last year.
March’s preliminary data showed orders for non-defense capital goods ex-aircraft – proxy for business capex plans – fell 0.4 percent m/m to a seasonally adjusted annual rate of $74.3 billion. The series peaked last August at $75.4 billion.
The ISM services index (April) is scheduled for Wednesday. Services activity contracted 3.9 percentage points m/m in March to 51.2 percent. The index has been above 50 the last three months after dropping to 49.2 percent last December.
Productivity (1Q23) is on tap for Thursday. In 4Q22, non-farm output per hour contracted 1.8 percent year-over-year. This was the fourth consecutive quarterly decline y/y.
Friday brings payroll (April). The average non-farm job creation the first three months this year is 345,000, down from last year’s 399,000 and much lower from the 2021 monthly average of 606,000.
WTI crude oil: Currently net long 249.1k, down 16.2k.
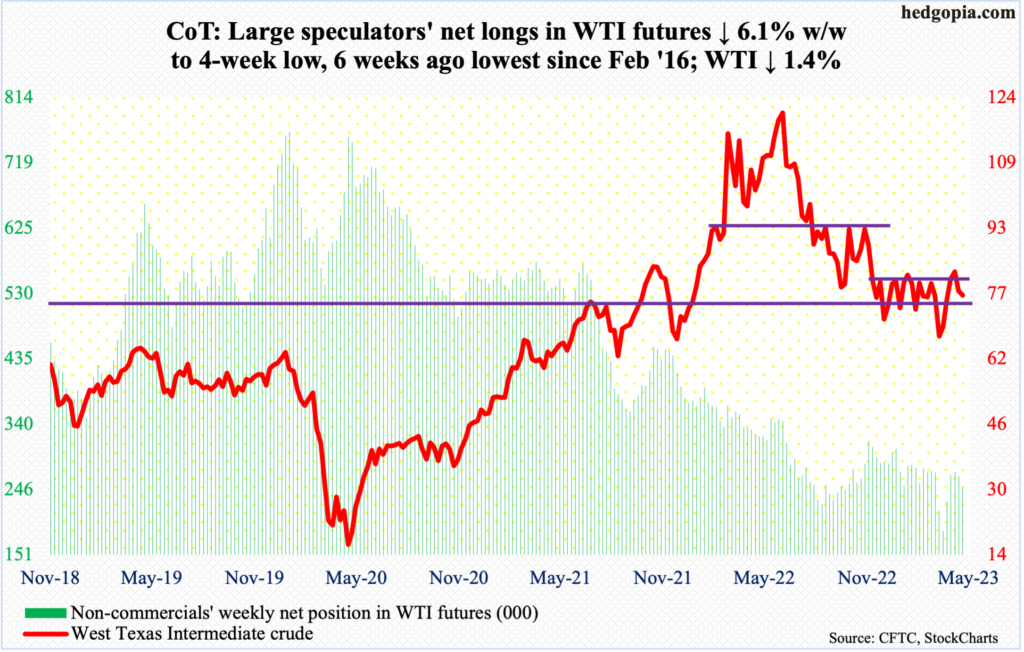
Early this month, WTI broke out of a four-month range between $71-$72 and $81-$82, but oil bulls were unable to meaningfully build on it. By the 12th, the crude tagged $83.53 intraday just under the 200-day moving average and retreated. This Friday, it ticked $73.93 intraday, and bids were waiting near the lower Bollinger band ($74.21), closing the session at $76.78/barrel.
The daily is oversold. The bulls have an opportunity here to once again rally to the upper end of the above range.
In the meantime, as per the EIA, US crude production in the week to April 21 declined 100,000 barrels per day week-over-week to 12.2 million b/d. Crude imports grew 82,000 b/d to 6.4 mb/d. Stocks of crude, gasoline and distillates all fell – by 5.1 million barrels, 2.4 million barrels and 577,000 barrels to respectively 460.9 million barrels, 221.1 million barrels and 111.5 million barrels. Refinery utilization increased three-tenths of a percentage point to 91.3 percent.
E-mini S&P 500: Currently net short 363.3k, up 19k.
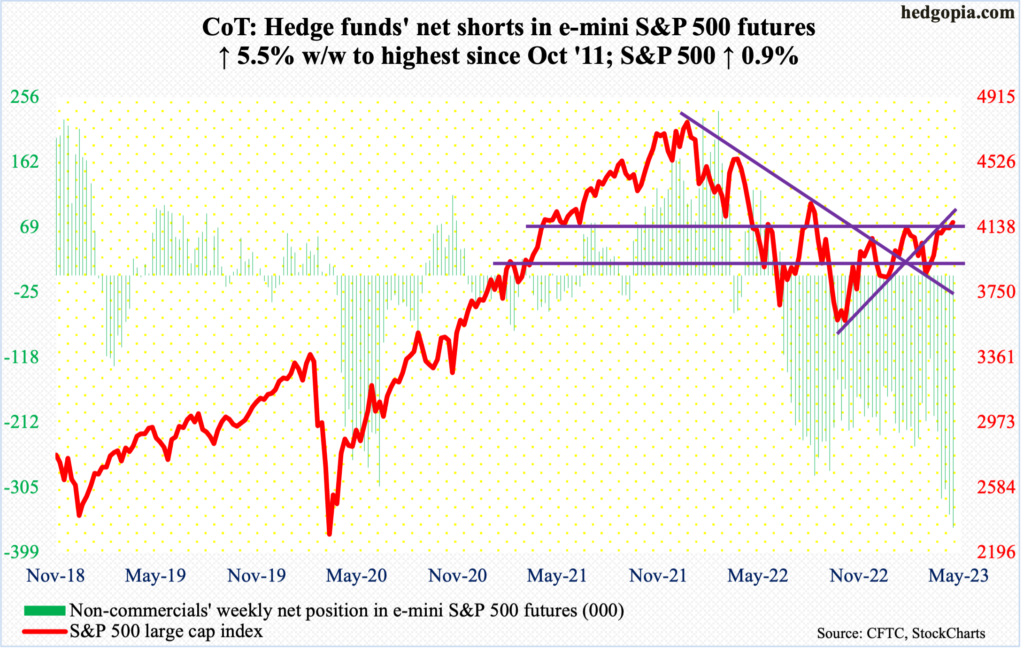
Non-commercials are not letting up. They added another 19,010 contracts to go net short 363,267. This is the shortest they have been since October 2011. Holdings are as of Tuesday. It is possible some level of short squeeze took place by the end of the week.
By Wednesday’s low of 4049, the S&P 500 was down two percent for the week; the 50-day (4034) was just underneath. That low was bought. By the end of the week, the large cap index reversed to go up 0.9 percent for the week. In the end, the weekly produced a candle that we will find out in due course of time if it is a hanging man or a hammer. Given the uptrend the S&P 500 has been in since last October’s low, odds favor it is the former. Before this week, there were two weekly dojis in three weeks.
The index (4169) closed right into 4170s resistance. In an FOMC week, a sustained breakout will be a major win for the bulls.
Euro: Currently net long 169.4k, up 5k.
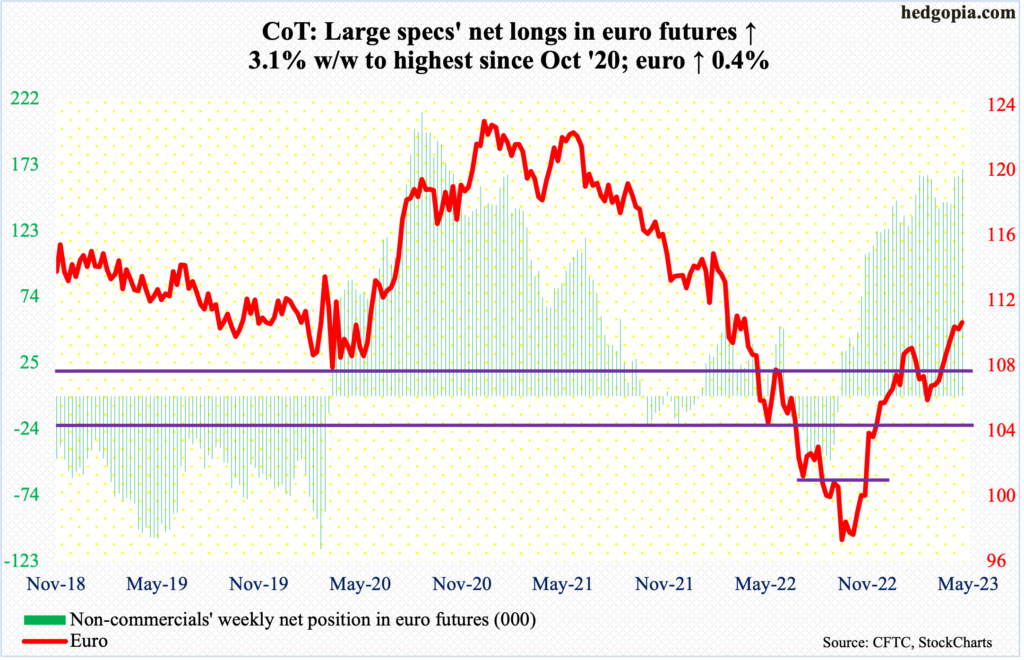
Euro bulls continue to hammer on $1.09-$1.10, but a decisive breakout is eluding them. Intraday Wednesday, the euro touched $1.1095, but only to end the week at $1.1025. A couple of weeks ago, it tagged $1.1074 intraday on the 14th but closed out the week at $1.10.
Amidst this, the daily Bollinger bands are beginning to narrow. This usually tends to precede a sharp move – either up or down. A decisive takeout of $1.09-$1.10 will obviously resolve this to the upside but until the resistance falls, it is a toss-up between bulls and bears.
Gold: Currently net long 185.3k, down 4.6k.
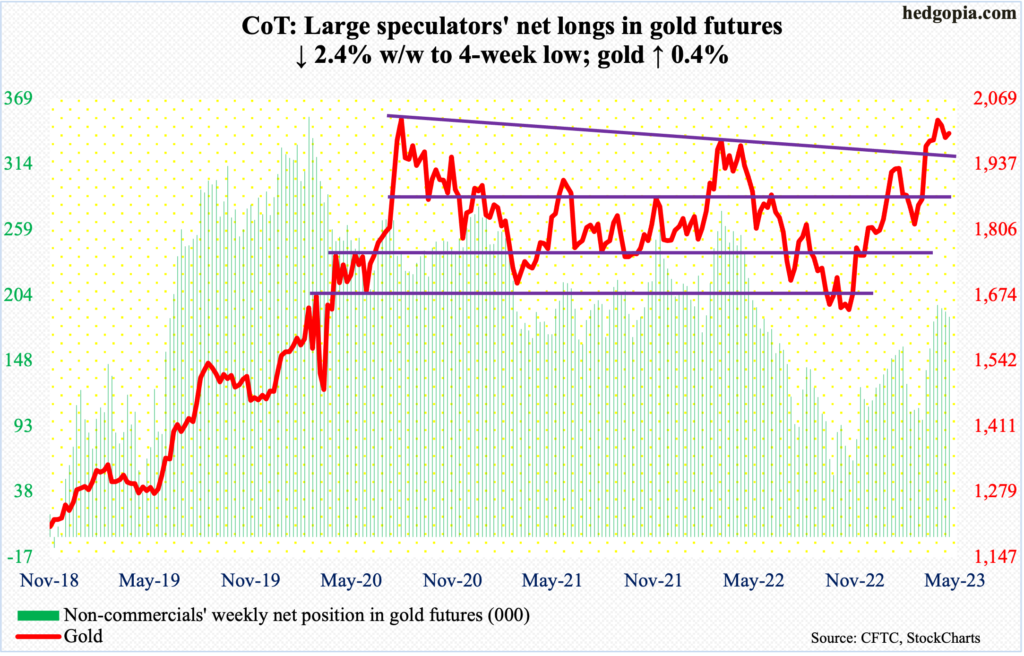
Gold was up 0.7 percent this month to $1,999/ounce, but the monthly candle left a long upper wick. This was the third unsuccessful attempt north of $2,050 in a little under three years.
In August 2020, the metal ticked $2,089, which was a new record. Then, in March 2022, it tagged $2,079 before rolling over. This time around, gold touched $2,063 on the 13th this month and headed south.
From gold bugs’ perspective, the good thing is that the lateral support at $1,970s-$1,980s remains intact. Continued defense of this level raises the odds that gold at least wants to go test this month’s highs.
Nasdaq 100 index (mini): Currently net long 5.1k, up 2.5k.
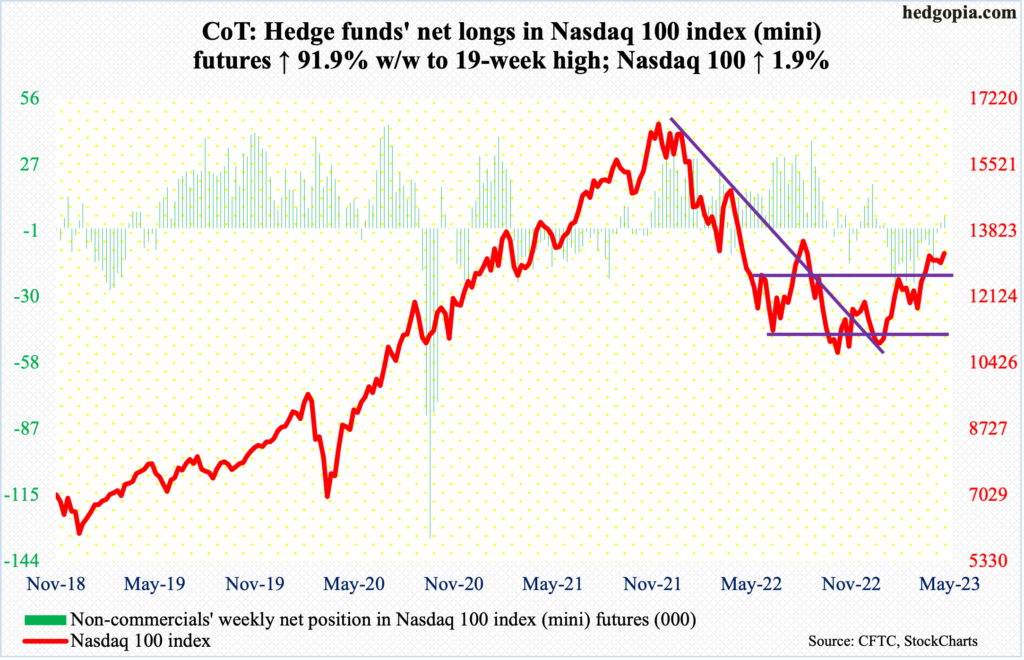
For the most part, stocks of the major US tech companies reporting their March quarter this week drew positive reaction (more on this here). Microsoft (MSFT), Google parent Alphabet (GOOG) and Facebook parent Meta Platforms (META) were up for the week, while Amazon (AMZN) was down. The Nasdaq 100 jumped 1.9 percent.
The tech-heavy index was denied at 13100s for four consecutive weeks and managed this week to poke its head out of this, having closed at 13246. The breakout is hardly decisive, though. Non-commercials, having switched to net long last week and having added more this week, are acting as if a breakout is imminent.
Besides the FOMC meeting next week, Apple (AAPL) reports on Thursday.
Russell 2000 mini-index: Currently net short 52.1k, down 7k.
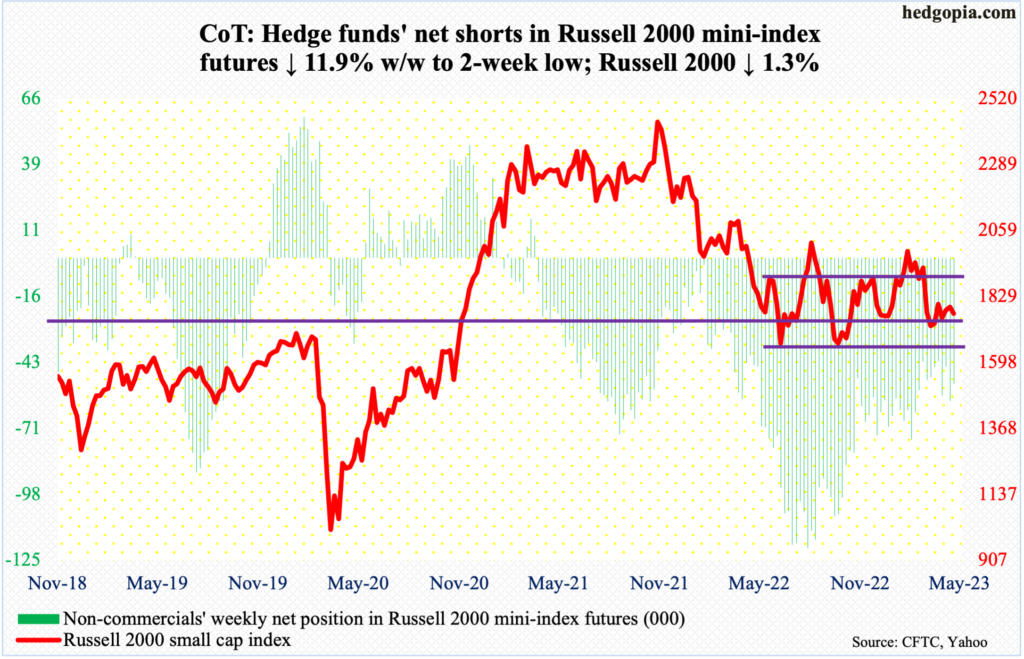
The Russell 2000 came close to testing the lower end of a range it has been in since January last year, having tagged 1726 on Wednesday and 1727 on Thursday. For nine sessions now, the small cap index (1769) has been unable to close above 1800 – the mid-point of the 1700-1900 range in question.
Mid-March, the index was held down by the underside of a broken rising trendline from last October. There have been several other tests since, all to no avail.
Small-caps continue to be a show-me story. Near-term, the daily has room to rally.
US Dollar Index: Currently net long 10.7k, up 226.
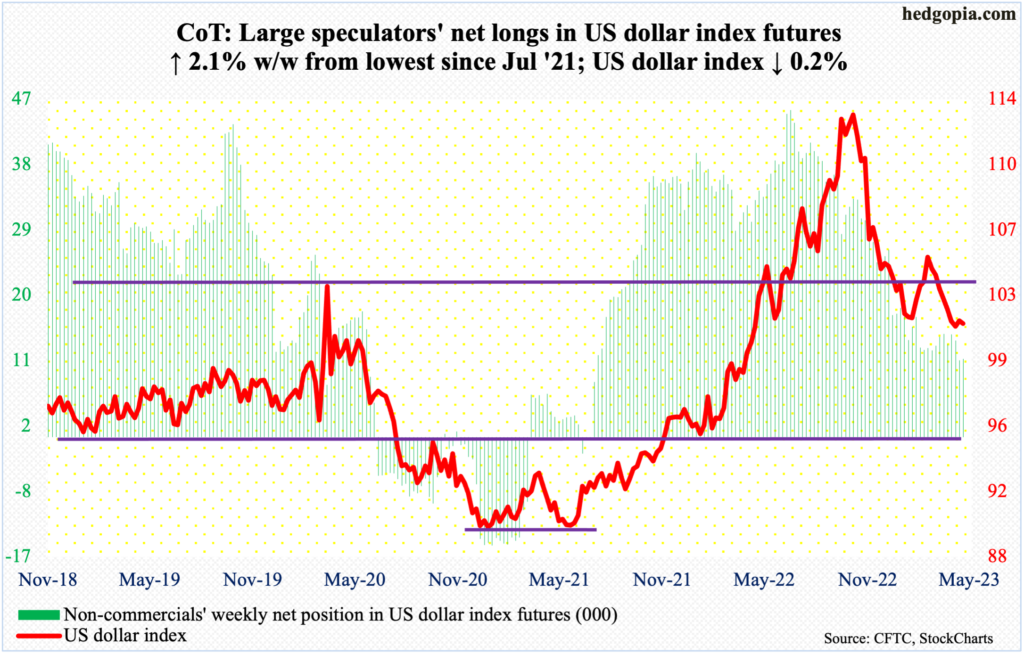
Last week, the US dollar index rose 0.3 percent – first up week in eight. This week, it shed 0.2 percent, forming a weekly long-legged doji.
The April 14th low of 100.42 stands. At 100-101 lies eight-year horizontal support. Thus far, dollar bulls have done a good job of defending it, with the week closing out at 101.40. In the right circumstances for them, a bullish crossover between 10- and 20-day seems imminent. Plus, the daily Bollinger bands continue to narrow. The US dollar index peaked last September at 114.75. A reflex rally could be due.
VIX: Currently net short 81.9k, up 18.1k.
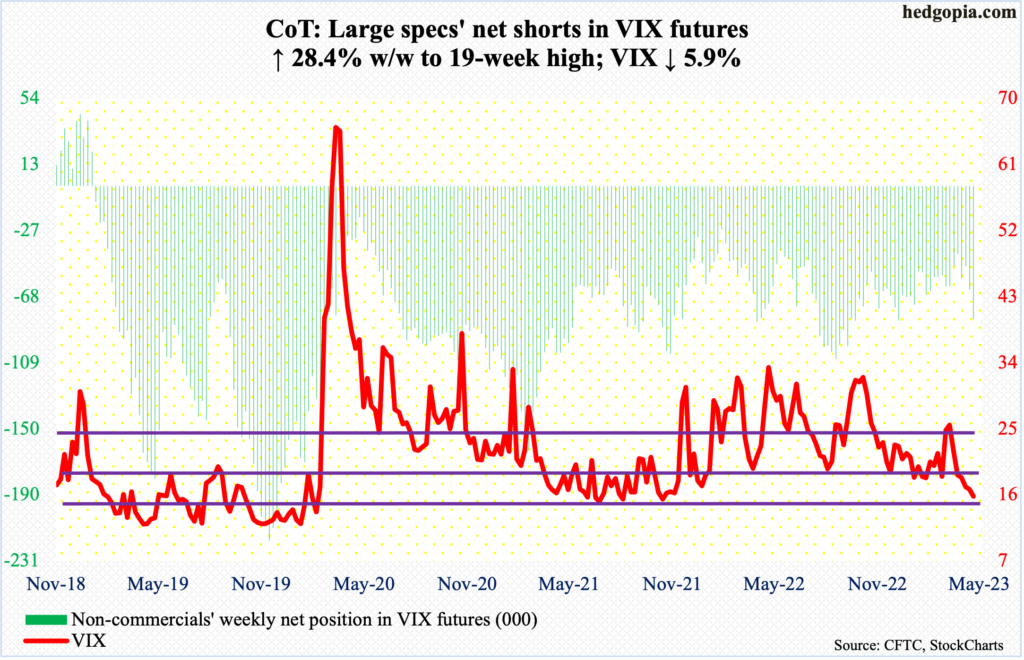
Non-commercials raised net shorts to a 19-week high. The timing was perfect.
This week, VIX dropped 0.99 points to 15.78, which was the lowest print since November 2021. This month, the volatility index also breached a rising trendline from November 2017 when it fell to an all-time low of 8.56.
Nearest straight-line support lies at low- to high-14s.
Thanks for reading!
