
Following futures positions of non-commercials are as of June 6, 2023.
10-year note: Currently net short 753.7k, down 96.7k.
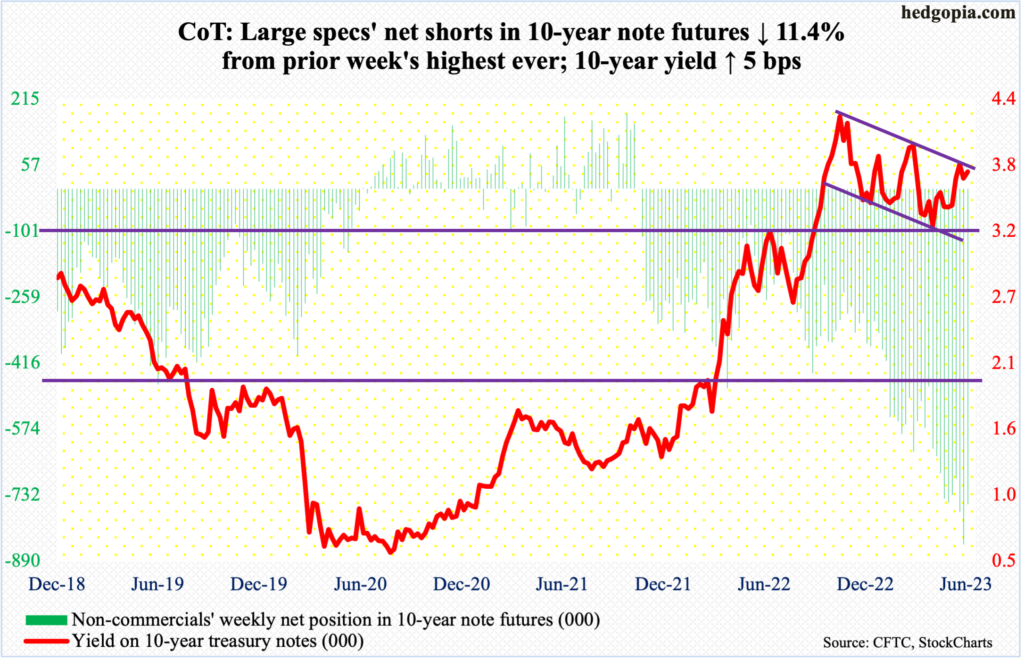
The FOMC begins a two-day meeting on Tuesday. After raising the fed funds rate by 500 basis points since March last year to a range of 500 basis points to 525 basis points, a pause was signaled in the last meeting (May 2-3).
Futures traders are betting that the Federal Reserve will stand pat next week. At the same time, they now expect one more 25-basis-point hike in July. Until just a few weeks ago, their money was on a terminal rate of 500 basis points to 525 basis points, followed by up to three 25-basis-point reductions by December. Fast forward to now, they now expect one cut, ending 2023 at 500 basis points to 525 basis points. They have either decided that the Jerome Powell-led Fed is not going to acquiesce to markets’ unreasonable demands or are adjusting themselves to persistently strong jobs data plus sticky inflation.
Next week’s meeting accompanies a summary of economic projections. In the March meeting, the dot plot signaled a peak rate of 500 basis points to 525 basis points, which is where the benchmark rates are currently. It will be interesting to see how the plot evolves given continued strength in jobs and inflation that is not dropping as fast as the central bank would like.
Given these dynamics, it is looking probable that the Fed will end up hiking at least one more time after July’s expected hike, taking the fed funds rate to a range of 550 basis points to 575 basis points. This likely gets signaled next week.
It is not just the Fed that is being forced to adjust to new reality. Several other central banks are doing the same. On Tuesday and Wednesday this week respectively, the Reserve Bank of Australia and the Bank of Canada delivered a surprise hike.
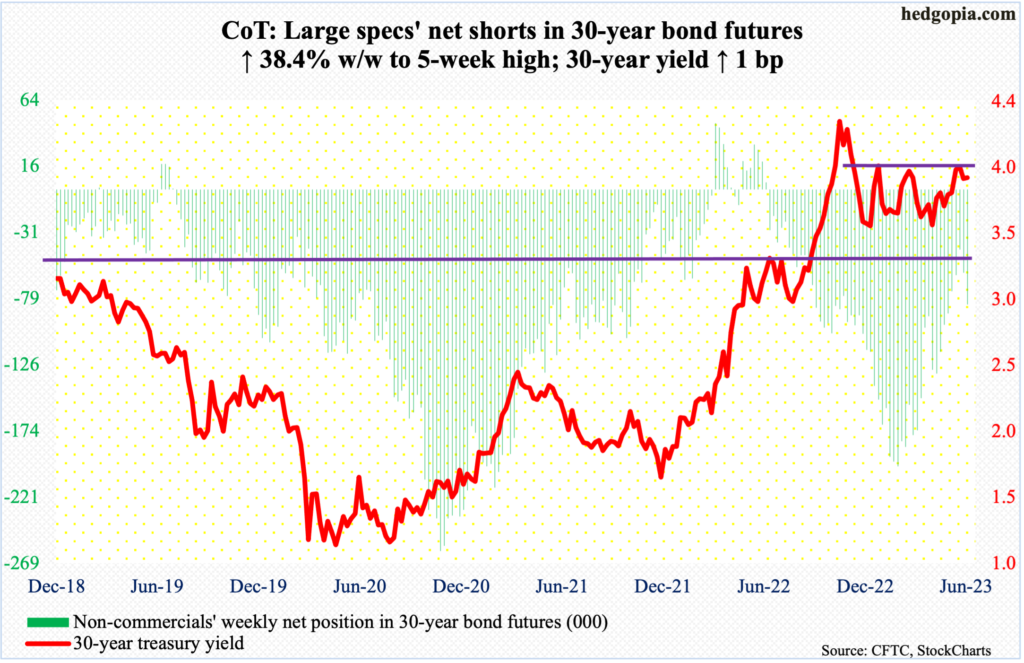
30-year bond: Currently net short 82.9k, up 23k.
Major US economic releases for next week are as follows.
On Tuesday, the NFIB optimism index (May) and the consumer price index (May) are due out.
Small-business optimism slid 1.1 points month-over-month in April to 89, which is the lowest since January 2013.
In the 12 months to April, headline and core CPI increased 4.9 percent and 5.5 percent, in that order. They respectively peaked last June and September at 9.1 percent and 6.6 percent.
The producer price index (May) is scheduled for Wednesday. Headline and core wholesale prices respectively rose 2.3 percent and 3.4 percent year-over-year in April.
Thursday brings retail sales (May) and industrial production (May).
April retail sales increased 0.4 percent m/m to a seasonally adjusted annual rate of $686.1 billion. A record high $692.5 billion was recorded in January.
Capacity utilization rose 0.4 percent m/m in April to 79.7 percent – a five-month high. Last September’s 80.8 percent was the highest since January 2008.
The University of Michigan’s consumer sentiment index (June, preliminary) will be out on Friday. Sentiment in May declined 4.3 points m/m to 59.2 – a five-month low.
WTI crude oil: Currently net long 184.5k, down 3k.
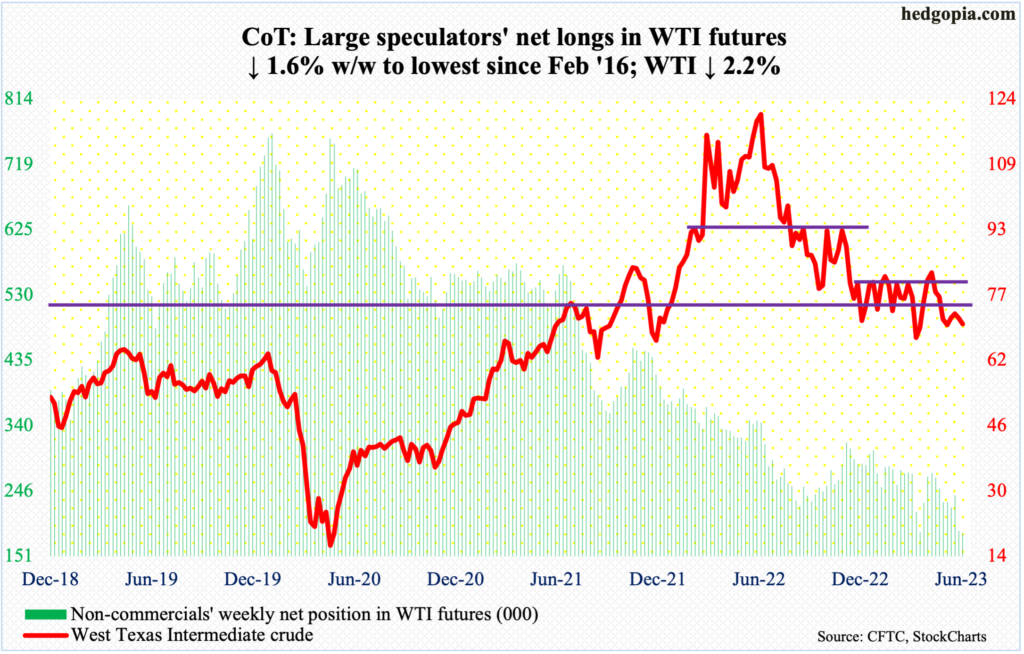
Saudi Arabia is making a big cut in output next month, promising to produce nine million barrels per day from around 10 mb/d in May. This will be in addition to an OPEC+ extension until the end of 2024 the existing cuts of 3.66 mb/d, made up of two mb/d agreed last year and 1.66 mb/d agreed this April.
OPEC+, which includes several non-OPEC producers including Russia, pumps about 40 percent of the world’s crude. On Monday, traders initially responded positively to the planned cut in production. WTI rose as high as $75.06 intraday but closed at $72.15 in that session; sellers showed up at the 50-day moving average.
Additionally, markets are beginning to focus more on the demand side than on supply. WTI continued lower through the week, touching $69.03 intraday Thursday and closing the week out at $70.17/barrel – below a six-month range between $71-$72 and $81-$82.
Oil bears are probably eyeing $63-$64.
In the meantime, as per the EIA, US crude production in the week to June 2 increased 200,000 b/d week-over-week to 12.4 mb/d, matching a 38-month high. Crude imports decreased 817,000 b/d to 6.4 mb/d. As did crude stocks, dropping 452,000 barrels to 459.2 million barrels. Stocks of gasoline and distillates, however, rose – up 2.7 million barrels and 5.1 million barrels respectively to 218.8 million barrels and 111.7 million barrels. Refinery utilization rose 2.7 percentage points to 95.8 percent.
E-mini S&P 500: Currently net short 344.5k, down 89.6k.
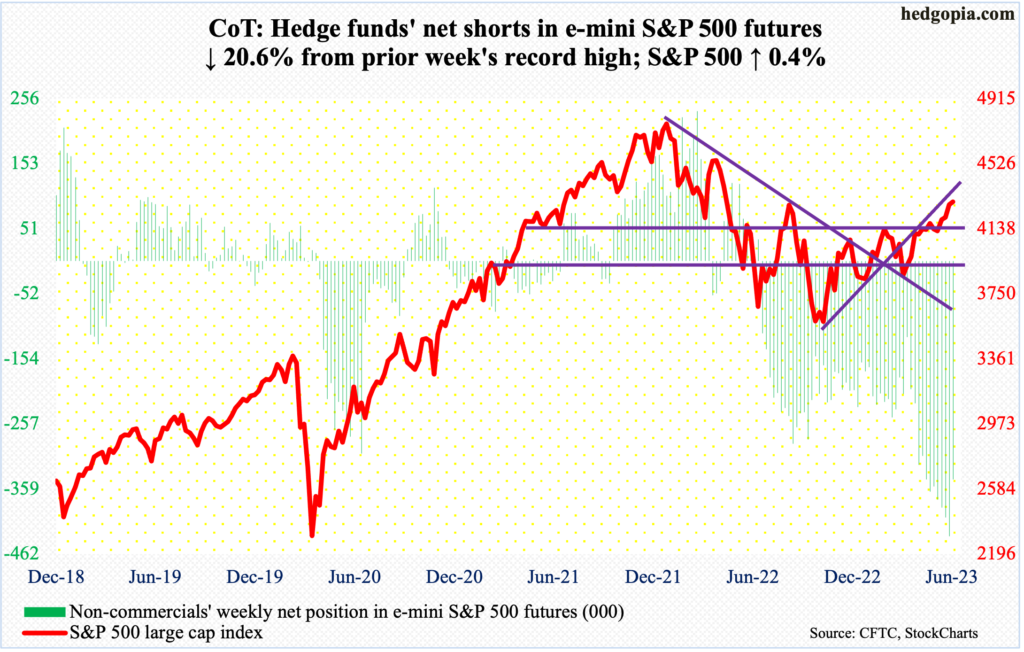
Equity bulls this week failed to hold on to all the gains but managed to rally the cash 0.4 percent anyway – fourth straight up week. At Friday’s high, the S&P 500 was up 0.9 percent for the week.
Through Tuesday, non-commercials cut their record net shorts by 20.6 percent, with the S&P 500 closing at 4284. A week ago – that is, as of May 30 when these traders were sitting on record net shorts – the large cap index closed at 4206. The short-covering has helped the bulls. But after Tuesday, either non-commercials stopped covering or the bulls themselves began to cash in on their recent gains. The index ended the week at 4299.
Bulls are probably not happy that they were unable to mop up all the offers that were likely to hit them at 4320s. Last August, the S&P 500 retreated sharply after hitting 4325; Friday’s high was 4323.
In the end, the week ended with a spinning top. The daily is way overbought. Failure to save 4290 can result in a hurried retest of 4200 – at least.
Euro: Currently net long 158.4k, down 7.3k.
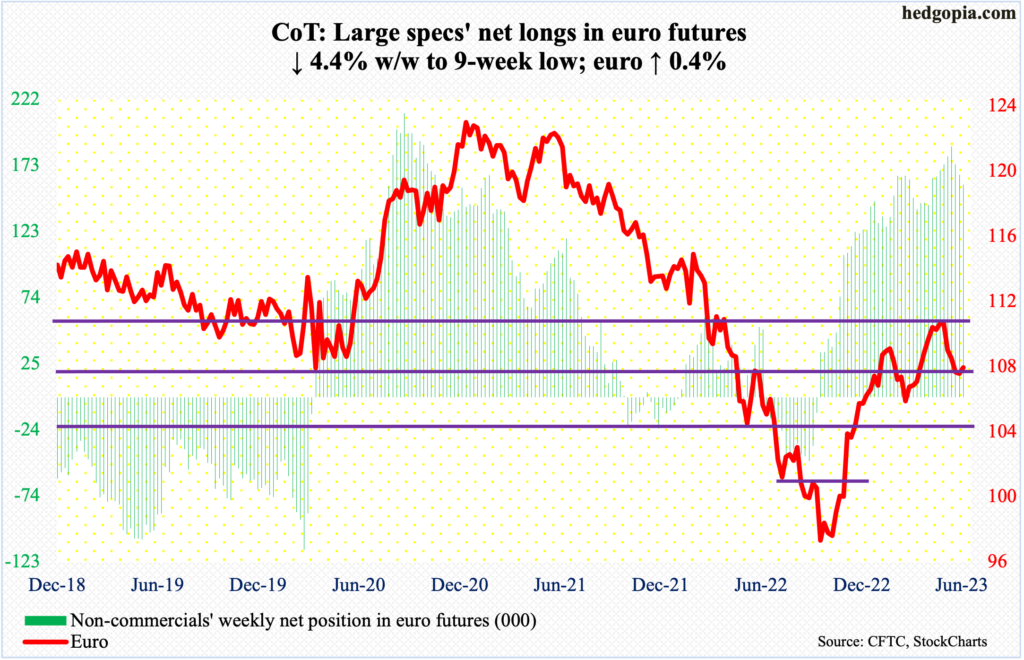
Euro bulls made further progress in defending $1.07-$1.08. Seven weeks ago, the currency tagged $1.1095, followed by $1.1092 the week after that, before coming under pressure.
Both this week and last, the euro breached $1.07 intraweek – $1.0667 and $1.0635 respectively but only to retake it by close. This week, it rose 0.4 percent to $1.0754.
As long as $1.07-$1.08 holds, bulls deserve the benefit of the doubt. A breach opens the door toward $1.04-$1.05, which has been an important level going back at least eight years and which was reclaimed last December and has not been tested since.
Gold: Currently net long 175.6k, up 6.3k.
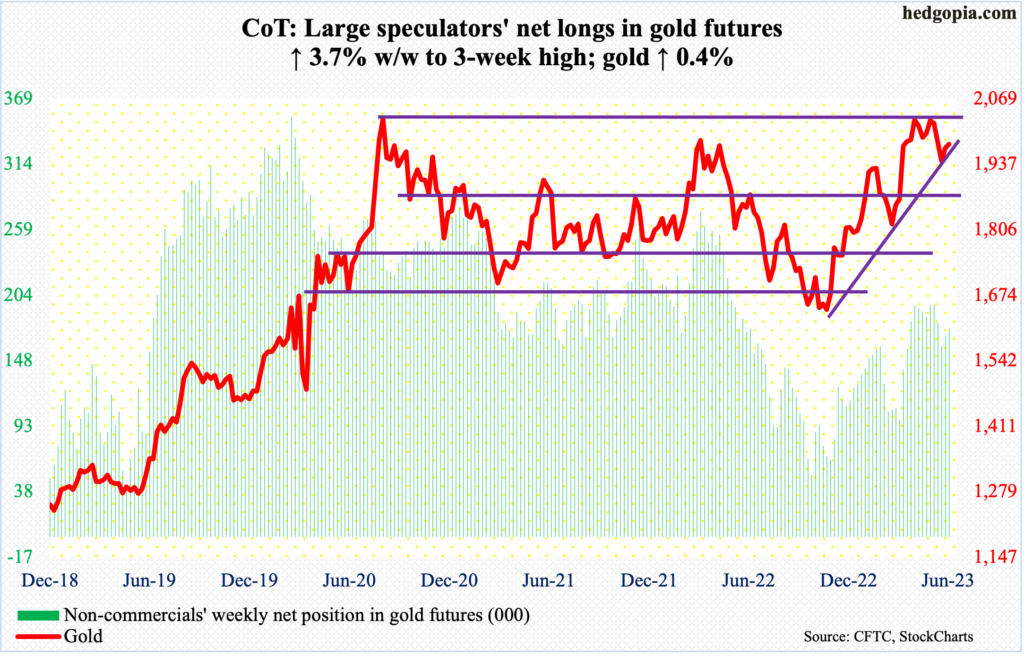
Gold had a second up week in a row, up 0.4 percent to $1,977/ounce. This followed three successive down weeks.
Last week, the metal attracted sellers at $2,000. This week, this took place at $1,980s. These are the hurdles gold bugs face for now. They have so far done a good job of defending a rising trendline from last October when gold bottomed at $1,620s. A breach of this trendline can lead the yellow metal hurriedly head toward $1,920s, which is a must-hold for the bulls.
Nasdaq 100 index (mini): Currently net long 8.8k, up 336.
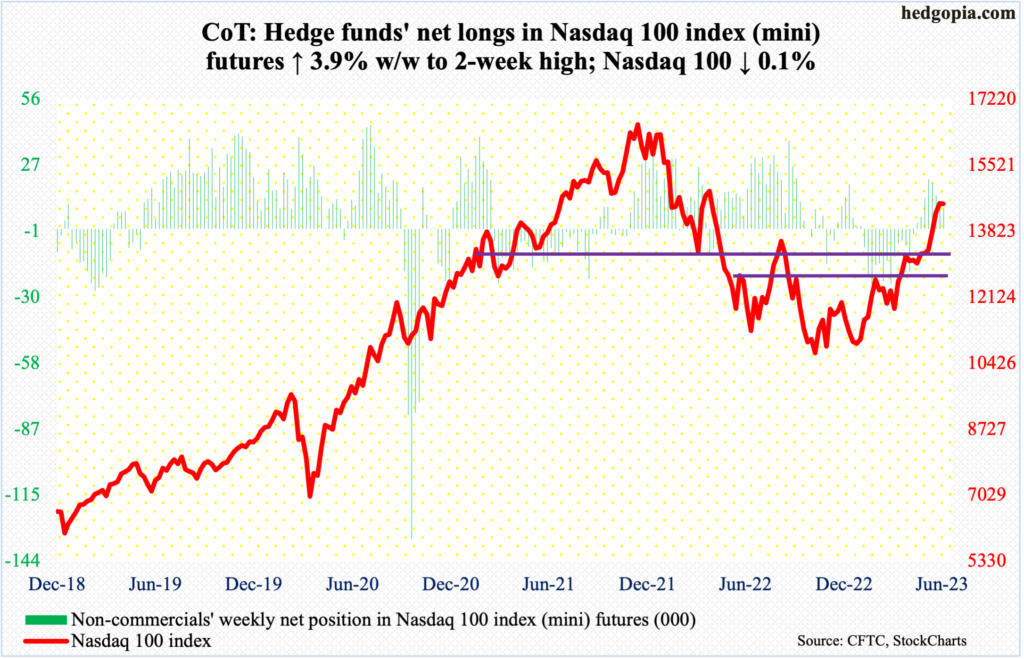
Last week, the Nasdaq 100 rallied 1.7 percent, forming a weekly candle that is either a hammer or a hanging man. This was followed this week by a weekly spinning top. From up 0.9 percent intraday Friday, the tech-heavy index reversed to inch lower 0.1 percent for the week. This follows six consecutive up weeks. From last October’s low through Friday’s high, the index jumped 40.5 percent. Having shown up after such a big run, odds favor last week’s candle is a hanging man, which is bearish.
The Nasdaq 100 is struggling to decisively take out 14500s. Last week, it rallied as high as 14596 but closed at 14547. This week, it closed at 14528, although it ticked 14673 intraday Friday.
Signs of fatigue are showing up, even as the weekly RSI is at overbought 72. In due course, breakout retest at 13100s is the path of least resistance.
Russell 2000 mini-index: Currently net short 62.6k, down 474.
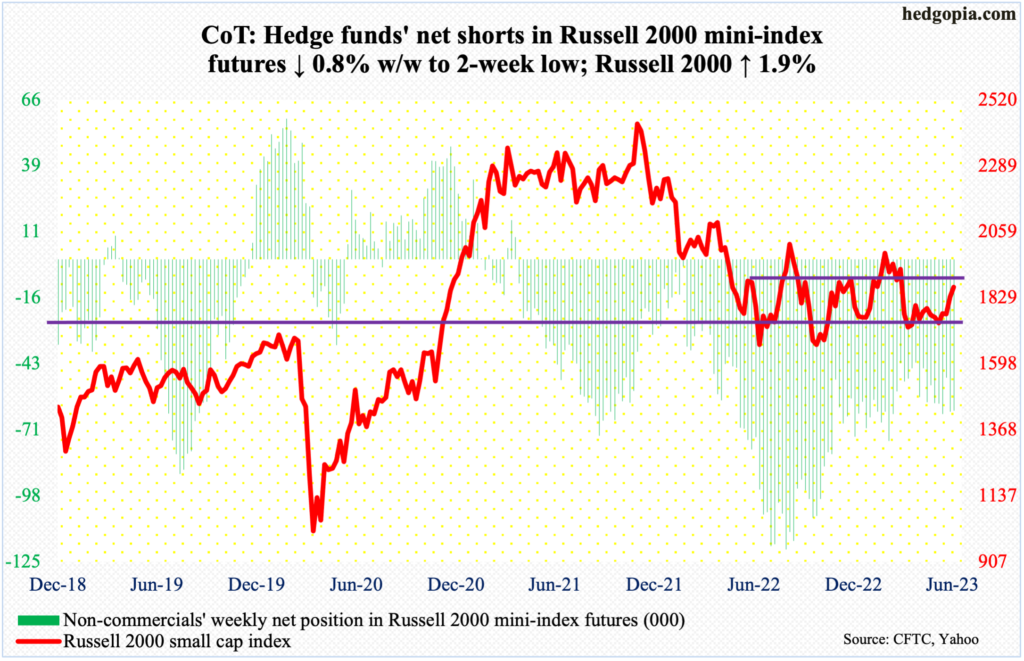
Small-cap bulls came close but ran out of steam in the 11th hour. After reclaiming 1800 – the mid-point of a year-and-a-half range between 1700 and 1900 – last week (more on this here), they went after 1900 this week, but to no avail.
Intraday Wednesday, the Russell 2000 tagged 1894, followed by 1880s on both Thursday and Friday, but only to reverse and end the week at 1866. This raises the odds of a journey back toward 1800, which resisted rally attempts for three months before giving way last week. Bulls better hope this now acts as support.
US Dollar Index: Currently net long 12.2k, down 549.
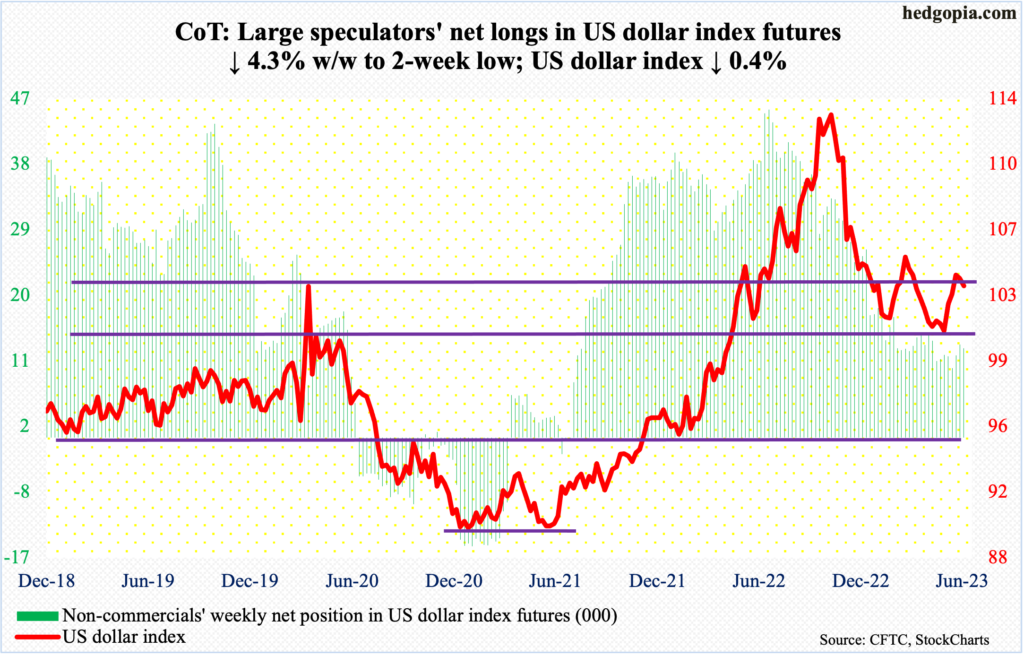
The US dollar index’s struggle at 103-104 continues. Dollar bulls could hardly hold on to Monday’s high 104.36. In the next four sessions, lower highs were made, finishing the week at 103.53.
It increasingly feels like the dollar index wants at some point to go test 100-101, wherein lies eight-year horizontal support.
VIX: Currently net short 57.8k, down 4.7k.
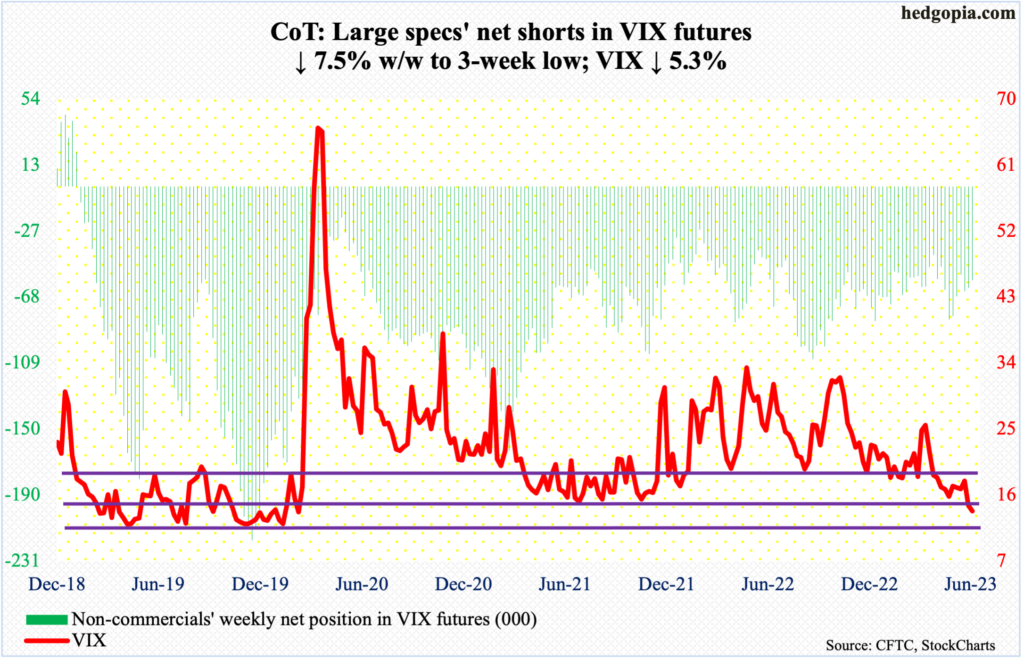
Friday’s intraday low of 13.50 was the lowest since February 2020; the session also formed a daily spinning top. It is early, but it could be a sign that volatility is tired of going down.
Amidst this, the options market is beginning to show marked rise in investor optimism. On Friday, the CBOE equity-only put-to-call ratio printed 0.497. In 13 of the last 15 sessions, readings have been in the 0.50s. The 10-day average was 0.573 on Friday, which was the lowest since last August. This is hardly frothy territory, but several times in the past the 10-day average has reversed higher from similar levels (more on this here).
Thanks for reading!
