
Following futures positions of non-commercials are as of July 11, 2023.
10-year note: Currently net short 635.1k, down 145.5k.
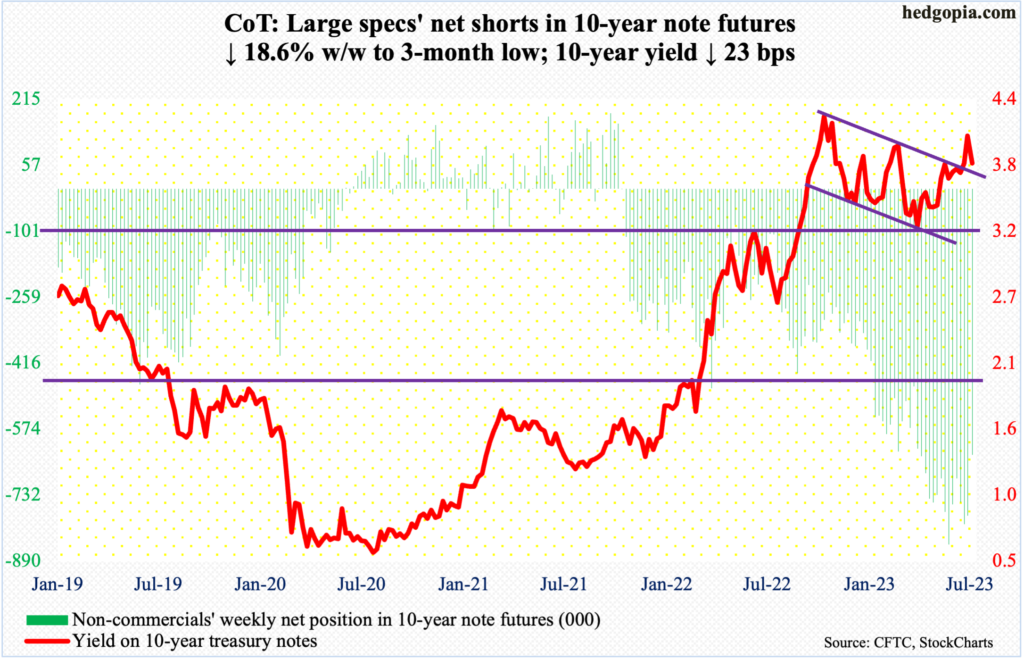
Last week’s channel breakout did not amount to much this week. Last October, the 10-year treasury yield retreated after tagging 4.33 percent. Since that high, the 10-year traded within a descending channel, which it broke out of last week.
This week, Monday’s intraday high of 4.09 matched the prior Friday’s high and then headed south – sharply. Wednesday’s softer-than-expected CPI report for June did not help. Last October’s high in the 10-year, therefore, stands.
This action on the long end of the yield curve comes amidst a 500-basis-point jump since March last year in the fed funds rate – and the pain the rise on the short end is likely to inflict on the economy in the out quarters. It seems non-commercials are beginning to subscribe to this view. They have been doggedly net short 10-year note futures, posting a new record of 850,421 contracts in the week to May 30 (this year). This week, they cut their holdings by 145,541 contracts week-over-week to 635,137. Continued reduction in and of itself can be a source of downward pressure on the 10-year yield, which finished the week at 3.82 percent.
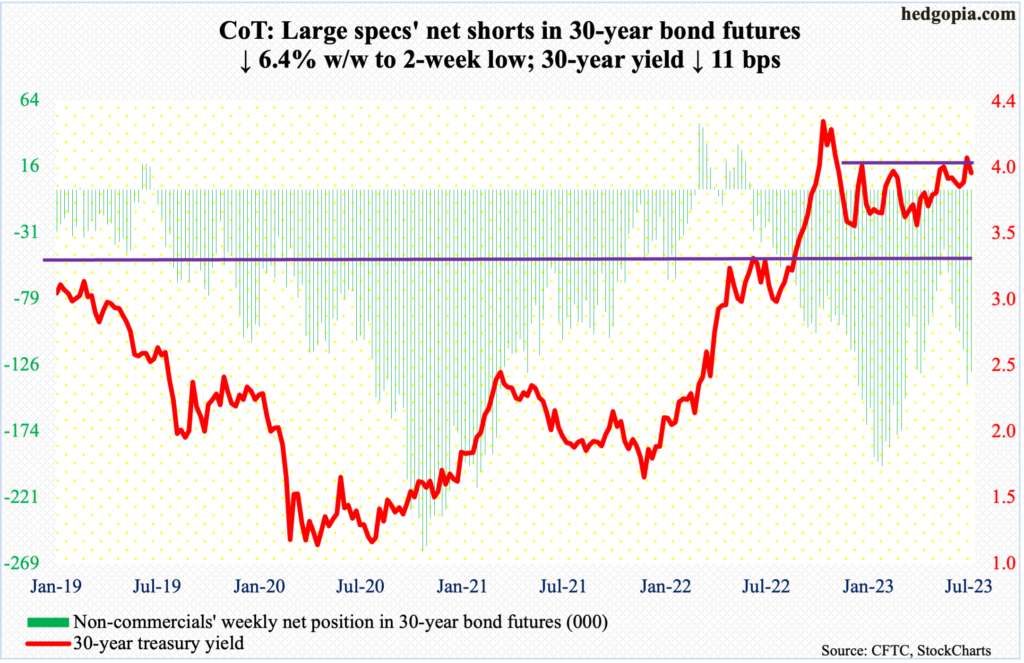
30-year bond: Currently net short 131k, down 8.9k.
Major US economic releases for next week are as follows.
On deck for Tuesday are retail sales (June), industrial production (June) and the NAHB housing market index (July).
Retail sales in May grew 0.3 percent month-over-month to a seasonally adjusted annual rate of $686.6 billion. Sales reached a record high $692.5 billion this January.
Capacity utilization decreased 0.3 percent m/m in May to 79.6 percent. Last September’s 80.8 percent was the highest since January 2008.
Homebuilder optimism in June increased five points m/m to 55. Optimism was languishing at 31 last December.
Housing starts (June) are due out on Wednesday. May starts jumped 21.7 percent m/m to 1.63 million units (SAAR), which was a 13-month high.
Thursday brings existing home sales (June). Sales inched up 0.2 percent m/m in May to 4.3 million units (SAAR) – a two-month high.
WTI crude oil: Currently net long 208.1k, up 34.5k.
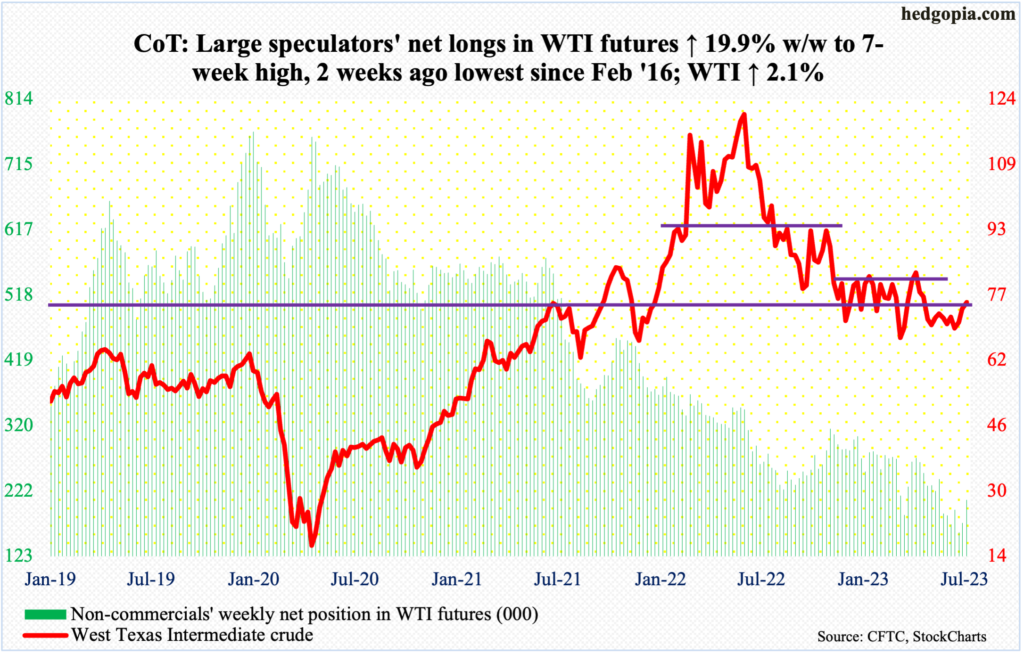
Last week’s successful push back into a seven-month range between $71-$72 and $81-$82 emboldened oil bulls to go after the upper bound but their journey was cut short at the 200-day.
Both Thursday and Friday, the average ($77.32) was tested with intraday highs of $77.33 and $77.30 respectively. West Texas Intermediate crude finished the week at $75.42/barrel.
The daily is now overbought. Odds favor a trip back to the lower bound of the range. The 50-day lies at $71.37.
In the meantime, as per the EIA, US crude production in the week to July 7 dropped 100,000 barrels per day w/w to 12.3 million b/d. Crude imports decreased 1.2 mb/d to 5.9 mb/d. Gasoline stocks edged lower 4,000 barrels to 219.5 million barrels. Stocks of crude and distillates, however, increased – respectively up 5.9 million barrels and 4.8 million barrels to 458.1 million barrels and 118.2 million barrels. Refinery utilization rose 2.6 percentage points to 93.7 percent.
E-mini S&P 500: Currently net short 209k, up 1.7k.
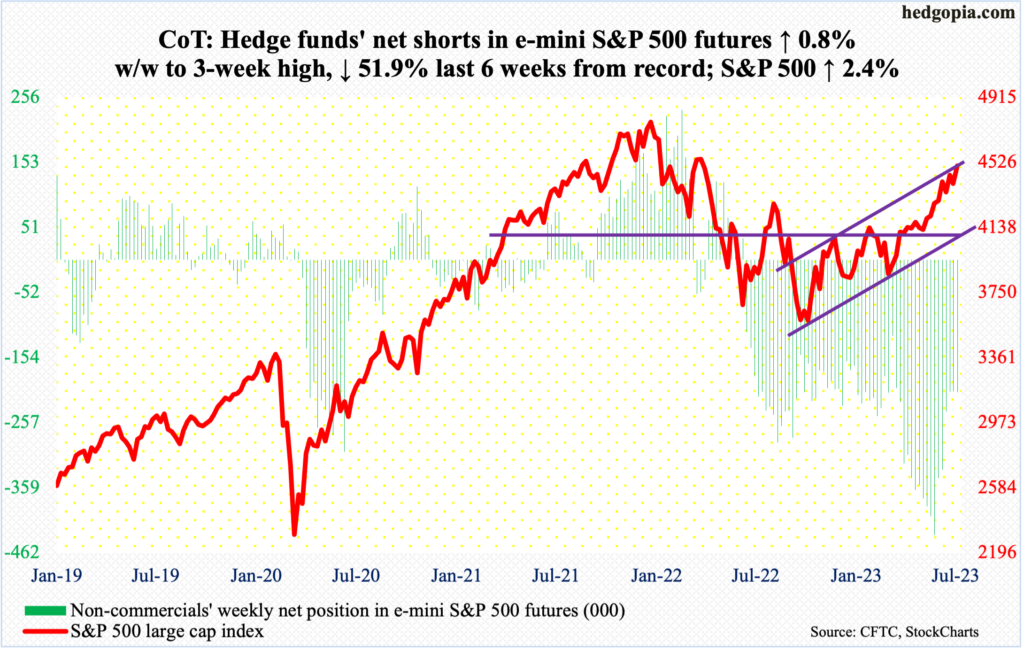
Sellers are on strike. They have been for a while now. This has given equity bulls an opportunity to use any positive data point – perceived or real – to their advantage. This week, a softer-than-expected CPI print (chart here) for June did the trick.
By the end of the week, the S&P 500 was up 2.4 percent. From last October’s low to Friday’s intraday high (4528), the large cap index has rallied 29.7 percent. This week’s Investors Intelligence report showed the bearish percent at 18.1 percent, which is the lowest since August 2021.
This also makes the job of buy-and-hold investors, who are getting in now, difficult. Last October, sentiment was panicky. Now, it is approaching the other extreme, if not already there. The overbought condition the large cap index increasingly finds itself in will get unwound. It is just a matter of time – or if the unwinding takes place from a higher level or right here.
This week’s rally took place all along the upper trendline of a rising channel from last October, even as there was a mini-breakout at 4450s. This is the one to watch for now. The bulls are probably not happy with the way Friday ended, as they were unable to hang on to the session high, ending at 4505.
Euro: Currently net long 140.2k, down 2.7k.
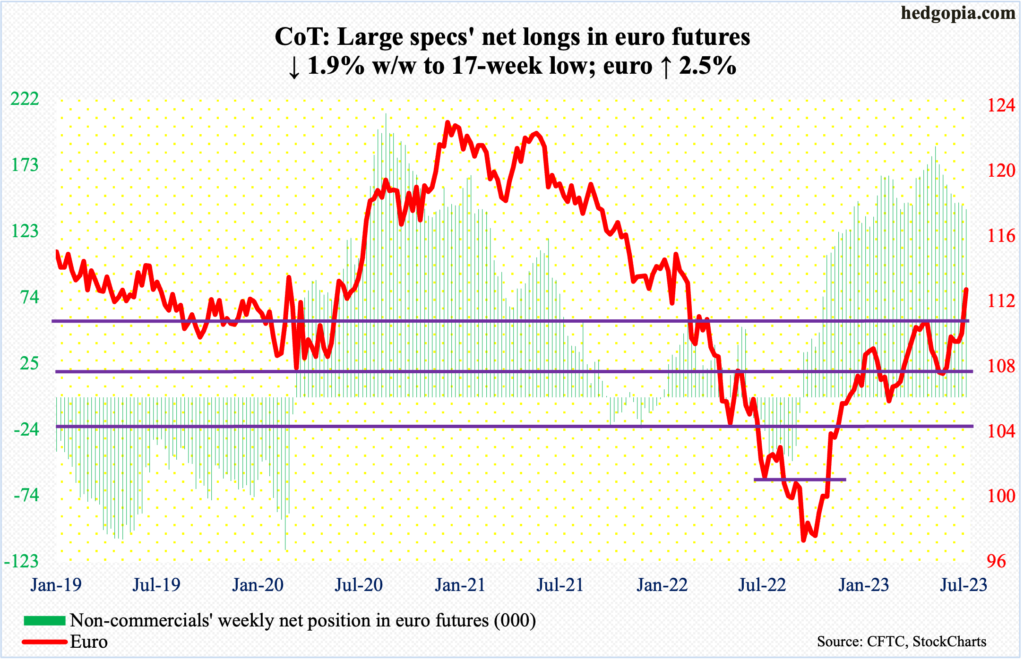
After hammering on $1.09-$1.10 several times since April, the euro finally broke out this week, ending up 2.5 percent to $1.1232, having tagged $1.1250 intraday Friday.
The currency bottomed at $0.9559 last September – and $1.0635 in late May.
There is still room for the weekly to continue higher. In this scenario, there is major resistance just under $1.15.
That said, several times in the past, the euro has tended to come under pressure as soon as the weekly RSI enters 70, or thereabouts. The metric closed this week at 70.24, with the daily RSI at 73.97.
With the recent move higher, the daily has entered overbought territory. Should mean-reversion unfold – likely – breakout retest at $1.09-$1.10 only makes sense.
Gold: Currently net long 165.8k, up 2.7k.
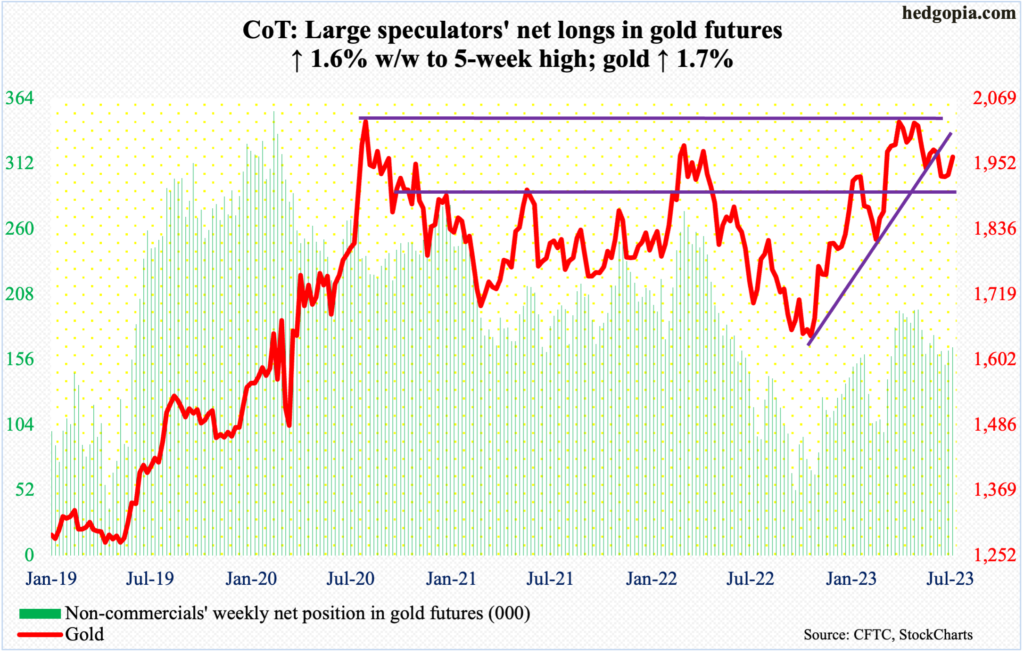
Gold had a good week – up 1.7 percent to $1,964/ounce – but it is also bumping into resistance at the 50-day ($1,970). Both Thursday and Friday, sellers started to show up just under the average, with the sessions respectively ending with a spinning top and a dragonfly doji. Should gold bugs manage to reclaim the average, then there is another potential roadblock at $1,980s. If both give way, then it is a safe bet that the metal in due course wants another shot at $2,080s.
On May 4 (this year), in a spinning top session, gold ticked $2,085 before retreating. This was an important price point. In the past, $2,089 was tagged in August 2020 – an all-time high – and $2,079 in March 2022.
Gold bugs failed to break out of $2,080s but have so far done a good job of defending $1,920s, a breach of which can prove costly.
Nasdaq 100 index (mini): Currently net long 10.9k, up 5.5k.
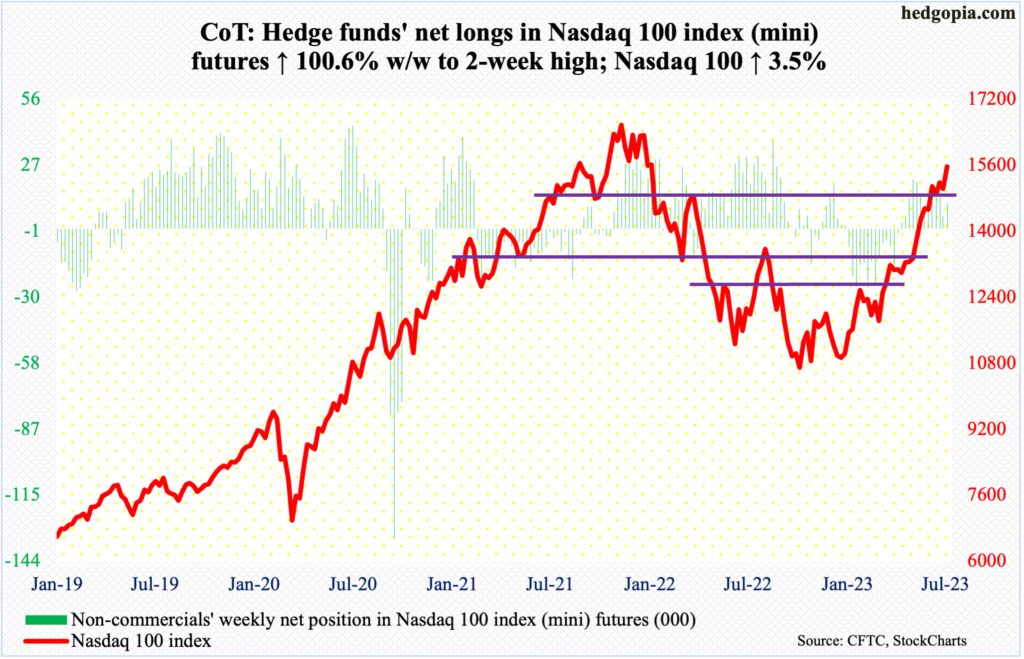
The Nasdaq 100 is 7.7 percent from its record high 16765 from November 2021. From that high through last October’s low, the tech-heavy index tumbled 37.7 percent. Then, from that low through Friday’s high, it jumped 50.6 percent.
Thursday, the index experienced a mini-breakout just under 15300. The momentum continued early Friday as the session touched 15720 intraday but only to give it all away and close the session/week at 15566.
Literally every technical indicator one looks at is screaming overbought, and that has been the case for several weeks, lending credence to the adage that overbought can stay overbought longer than one can remain solvent.
Amidst this, Friday’s mini reversal lower is worth watching. This has come just before tech behemoths begin to report their June-quarter results.
Russell 2000 mini-index: Currently net short 65.9k, down 1.6k.
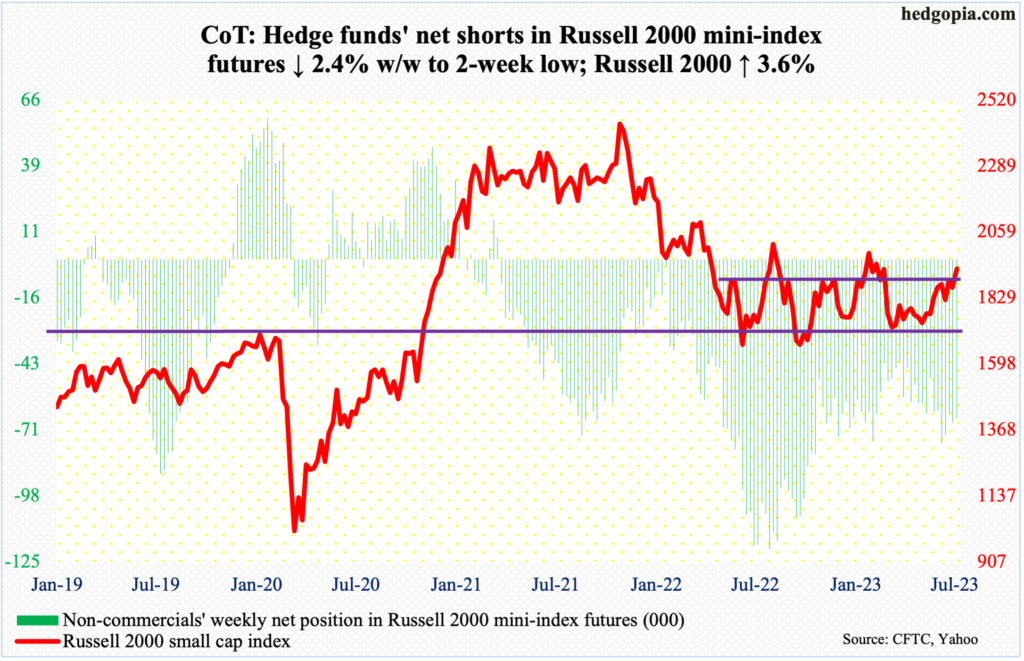
Similar to the Nasdaq 100, the Russell 2000 peaked in November 2021 at 2459 before suffering a 33.2-percent through June last year when the small cap index tagged 1641, which was later matched by 1642 in October. From the June 2022 low to August’s high of 2017, it quickly rallied 22.9 percent before momentum petered out. The August high is yet to be surpassed, followed by a lower high of 2007 this February.
On Thursday, the Russell 2000 rallied as high as 1953, even though it closed the week at 1931, up 3.6 percent for the week. Small-cap bulls should be happy how the week turned out, as 1900 finally gave in; plus, a golden cross formed (more on this here).
Since May last year, the index has nothing but played ping pong between 1700 and 1900, with false breakouts in August and February. Against this background, this week’s action has come at an interesting juncture.
If the breakout is genuine, the February high needs to go first. Better yet if this happens after a successful breakout retest at 1900. This is precisely how things turned out in the S&P 500, which took out last August’s high (4320s) on June 12; this was followed by a retest on June 16 and then an additional 200 points in three weeks.
US Dollar Index: Currently net long 12k, down 2.3k.
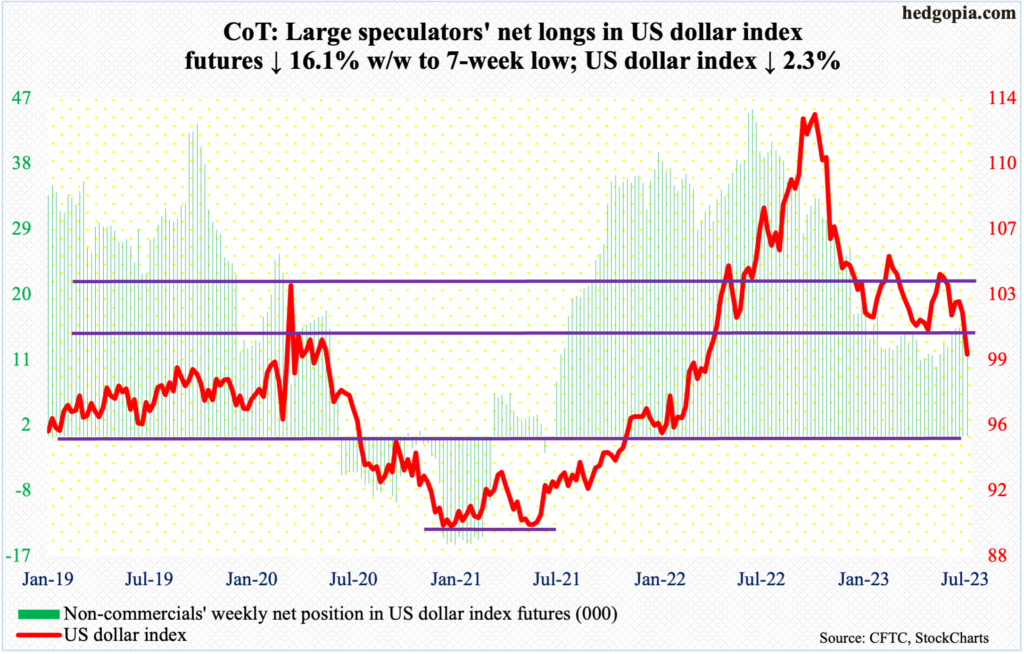
Dollar bulls’ inability to take out 103-104, which resisted breakout attempts several times in May and June, resulted in a breach this week of horizontal support at 100-101, which goes back eight years.
The US dollar index dropped 2.3 percent this week, having fallen for six sessions in a row through Thursday. Friday, too, was a downer early on, but bids appeared at 99.26, closing the session/week at 99.61.
The daily is grossly oversold, with the RSI at 28.44 – the first time the metric has gone sub-30 since December 2020. The path of least resistance near term is a rally toward where a breakdown occurred – that is, 100-101.
VIX: Currently net short 50.7k, down 4.2k.
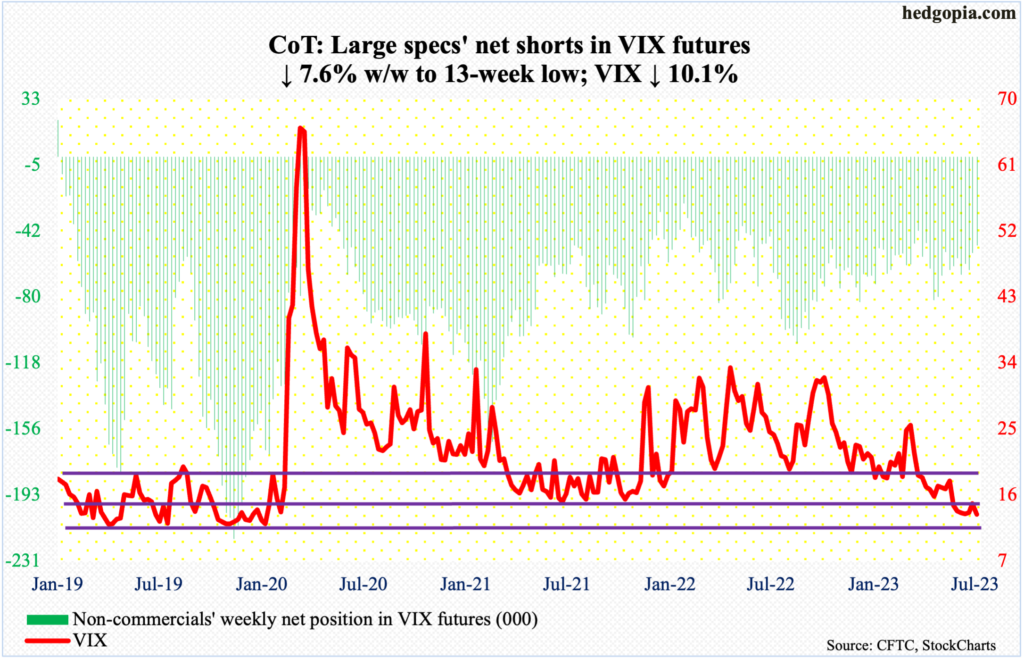
Last week, VIX perked up 1.24 points to 14.83, which, however, was significantly below the weekly high of 17.08 (on the 6th), leaving behind a long upper wick on both the daily and weekly. This week, the volatility index gave back 1.49 points to 13.34.
Sustained volatility remains a show-me story. On the other side of the spectrum, optimism among equity longs is very high. In the options market, the CBOE equity-only put-to-call ratio printed 0.39 on Tuesday, which was the first sub-0.40 reading since November 2021 (more on this here). The 10-day average of the ratio ended Friday at 0.511, which was the lowest since April last year. Nothing says it cannot continue lower. It has in the past. The only certainty is that of unwinding. The panicky readings of last October laid the foundation of the rally in the S&P 500 that followed; conditions are approaching the other extreme now.
Thanks for reading!
