
Following futures positions of non-commercials are as of August 29, 2023.
10-year note: Currently net short 805.6k, up 110.7k.
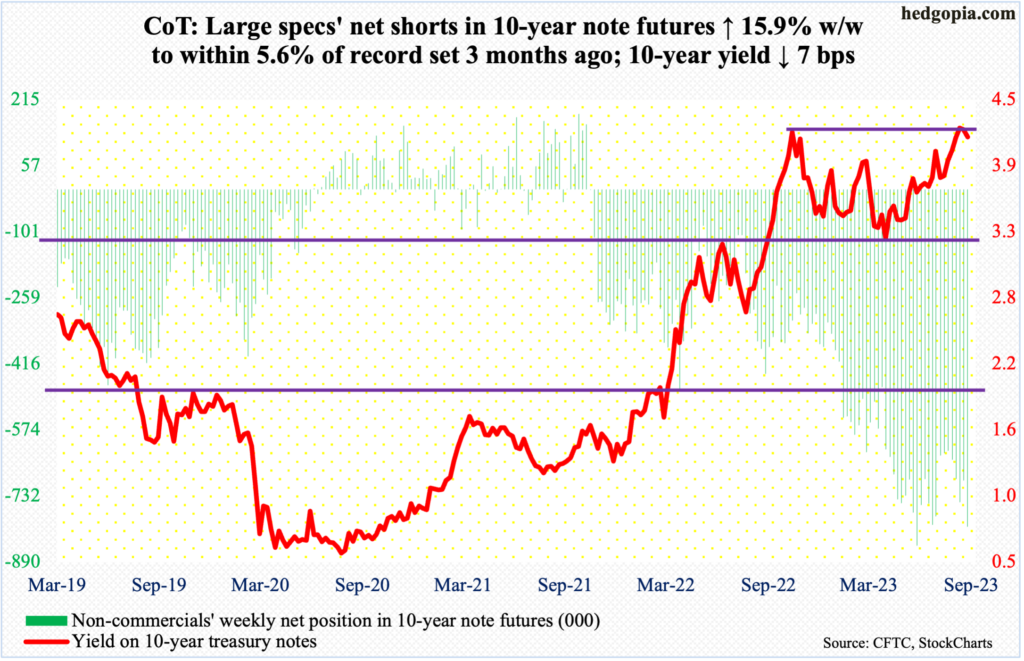
Non-commercials aggressively added to net shorts in 10-year note futures. This week’s count of 805,553 contracts is merely 5.6 percent from the record high posted three months ago, when these traders were net short 850,421 in the week to May 30th this year. Six weeks ago, in the week to July 25th, they had reduced holdings to 623,771 before once again showing aggression in their bearish bias; the 10-year yield finished that session at 3.91 percent and proceeded to rally to tag 4.36 percent on August 22. This, as it turns out, was an unsuccessful test of the prior high of 4.33 percent which was hit on October 21 last year. Time will tell, but this has the potential to be an important failure.
Before hitting the roadblock last month, the 10-year rate has had a phenomenal rally. As recently as this April, these notes yielded 3.25 percent – and 2.53 percent in August 2022 or 1.13 percent in July 2021. Non-commercials hence have done very well. They switched to net short in October 2021 and began to meaningfully add to positions beginning last December when in the week to the 20th they were net short 316,943 contracts. They kept adding, even as the rates headed higher. A decisive takeout of last October’s high would have probably added fuel to the fire as bond bulls begin to turn tail. That, however, is not the case. The 10-year ended last Friday at 4.17 percent, down seven basis points week-over-week.
The 10-year yield’s weekly is itching to go lower, even though the daily can rally here. Even if the latter prevails in the near term, it is unlikely August’s high yields. The Federal Reserve is nearing the end of its tightening cycle. Determined to get core PCE, which grew 4.2 percent in the 12 months to July, down to its two-percent target, the central bank has been eyeing closely its other mandate – jobs. Signs of deceleration are everywhere – ranging from non-farm openings to unemployment claims to non-farm payrolls. As this phenomenon takes deeper roots, this should begin to get reflected in bond yields. Odds favor the 10-year yield reached an important high last October and this August. If anything, non-commercials, with boatloads of bets betting on higher yields, face squeeze risks, which can put yields under more pressure.
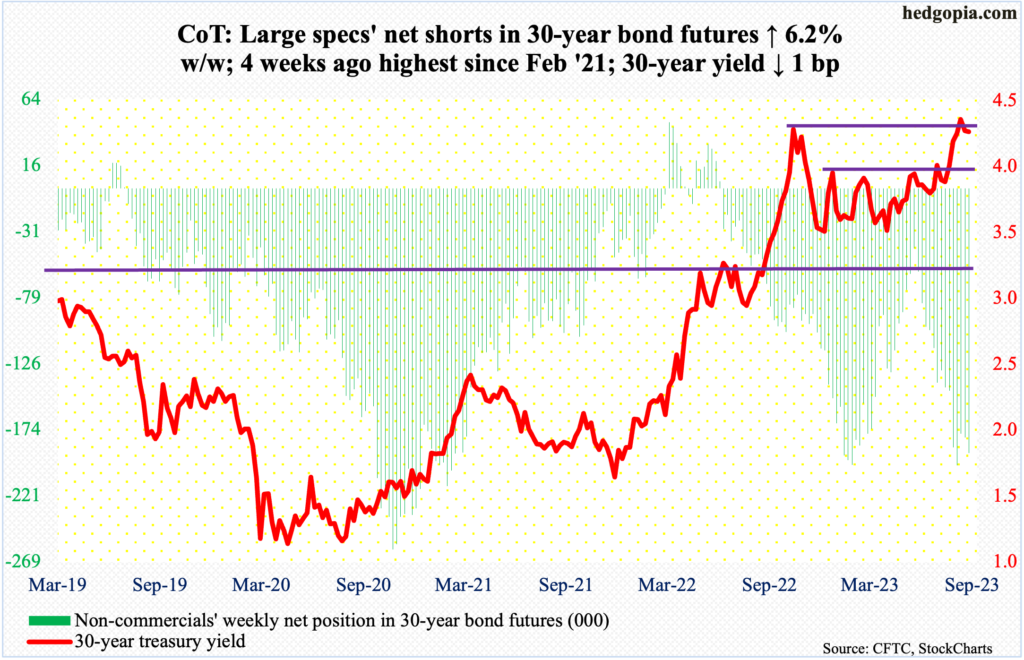
30-year bond: Currently net short 190.6k, up 11.1k.
Major US economic releases for next week are as follows. Markets are closed Monday for observance of Labor Day.
Durable goods orders (July, revised) are scheduled for Tuesday. Orders for non-defense capital goods ex-aircraft – proxy for business capex plans – edged up 0.1 percent month-over-month in July to a seasonally adjusted annual rate of $73.6 billion. A record high $73.9 billion was hit in May.
The ISM services index (August) is due out Wednesday. Services activity in July dropped 1.2 percentage points m/m to 52.7 percent. Except for a 49.2-percent reading last December, services activity has consistently been north of 50 percent.
Thursday brings labor productivity (2Q23, revised). Non-farm output per hour jumped at an annualized rate of 3.7 percent in the June quarter. From a year ago, it rose 1.3 percent, which was the first positive reading in six quarters.
WTI crude oil: Currently net long 260.7k, up 5.7k.
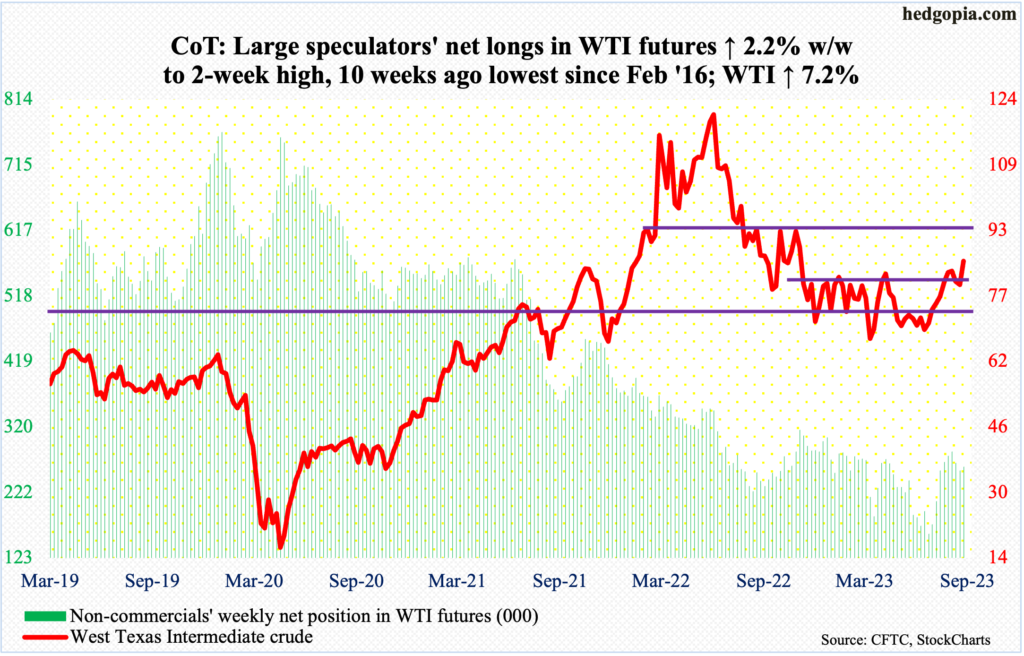
West Texas Intermediate crude busted through a nine-month range between $71-$72 and $81-$82, closing the week at $85.85/barrel. It has now rallied for seven consecutive sessions, having tagged $77.59 on August 24.
The daily is getting a little extended, with the daily RSI at 69.13. At least going back to June 2022, each time the metric hit 70, the crude struggled to sustain upward momentum. Should this phenomenon repeat itself in the sessions ahead, oil bulls need to defend $81-$82, else the crude drops back into the above-mentioned range.
In the meantime, as per the EIA, US crude production in the week to August 25 was unchanged w/w at 12.8 million barrels per day, which is the highest since March 27, 2020. Crude imports decreased 316,000 b/d to 6.6 mb/d. As did stocks of crude and gasoline, which respectively dropped 10.6 million barrels and 214,000 barrels to 422.9 million barrels and 217.4 million barrels; crude inventory is at a one-year low. Distillate stocks grew 1.2 million barrels to 117.9 million barrels. Refinery utilization declined 1.2 percentage points to 93.3 percent.
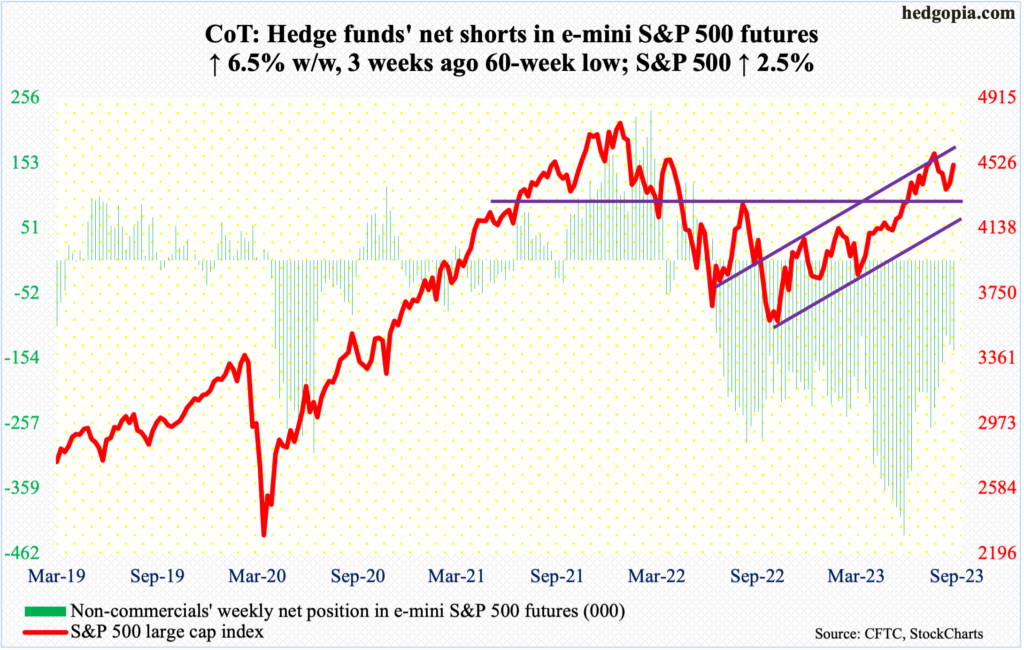
E-mini S&P 500: Currently net short 142.1k, up 8.6k.
The June-quarter earnings season is just about over. S&P 500 companies brought home $54.92 in operating (non-GAAP) and $48.74 in reported (GAAP) earnings – up 17.4 percent and 16.4 percent year-over-year and up 4.7 percent and 2.7 percent quarter-over-quarter (more on earnings dynamics between operating and reported as well as NIPA and non-GAAP here).
Earnings helped, as June and July were strong months for the S&P 500; August was down 1.8 percent but finished the month strong as the large cap index was down as much as 5.5 percent at the intraday low of 4335 on the 18th, which essentially retested the June 12th breakout at 4320s.
This week, equity bulls put up a strong showing, coming on the heels of last week’s rejection at 4450s, which was decisively reclaimed on Tuesday. The week finished at 4516, with both Thursday and Friday showing indecision. The daily just entered overbought territory. Bears are likely to get active here. If bulls cannot save 4450s, 4320s is a must-hold.
Euro: Currently net long 146.7k, down 12.1k.
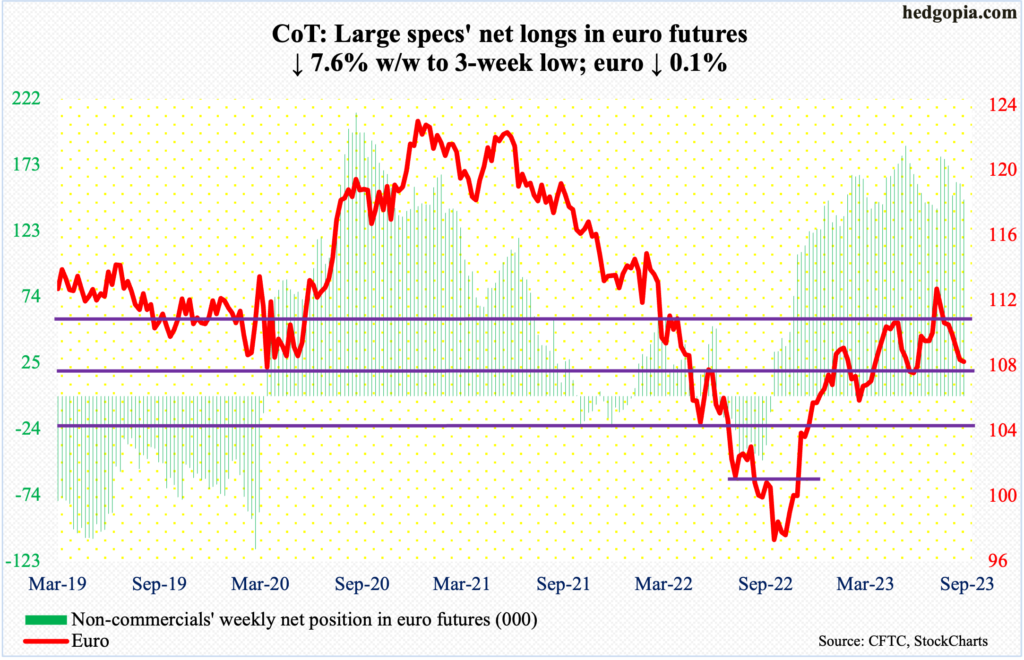
Bulls tried to rally the euro off of the 200-day, and they succeeded in that endeavor early on, as by Wednesday the currency tagged $1.0945, but only to then reverse lower to end the week at $1.0786 – just below the average at $1.08. Down 0.1 percent for the week, this was the seventh weekly decline in a row.
The euro rallied from $0.9559 last September to $1.1270 on July 18 this year. There is stiff resistance at $1.09-$1.10, which held. The weekly produced a shooting star. There is more to go on the downside on the weekly, and the monthly in particular.
There is decent support at $1.07. The May 31st low of $1.0635 is worth watching.
Gold: Currently net long 123.3k, up 21.3k.
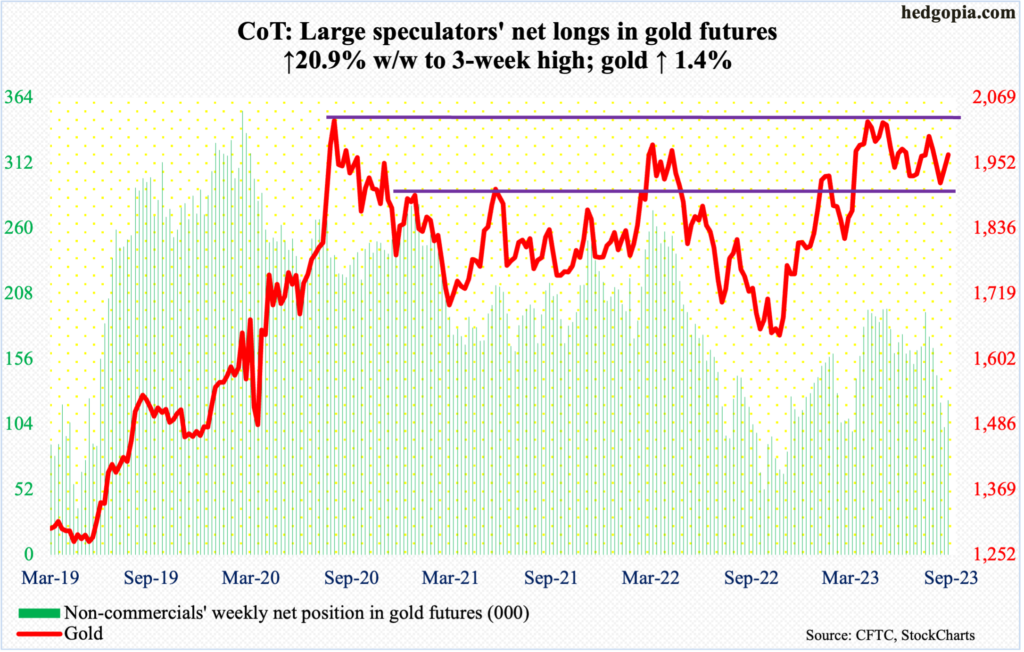
After two weeks of intraweek drops to $1,914, gold rallied 1.6 percent this week to $1,967/ounce. In essence, support at $1,920s was defended. And, after five weeks of reducing their net longs in gold futures, non-commercials added this week.
Despite this week’s action, gold bugs remain on the defensive. They had a tremendous opportunity in May to break out, but the yellow metal headed lower after ticking $2,085 on the 4th. In the past, $2,089 was tagged in August 2020 – an all-time high – and $2,079 in March 2022.
Nasdaq 100 index (mini): Currently net long 16.2k, up 2.3k.
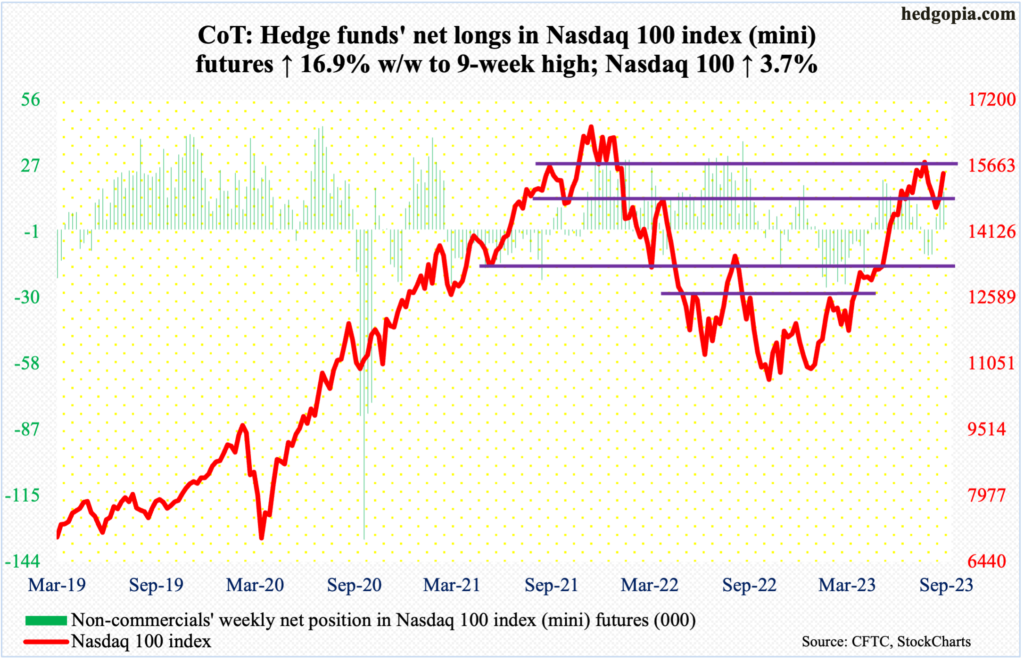
The Nasdaq 100 (15491) performed strongly, up 3.7 percent for the week. At Friday’s high, it was up as much as 15619. The tech-heavy index began to rally after ticking 14558 on August 18.
Some signs of fatigue are showing up, with both Thursday and Friday producing lackluster sessions for the bulls. Inability to take out the July 19th high of 15932 will have established a pattern of lower highs. Last November, the Nasdaq 100 peaked at 16765, followed by a lower high of 16607 in December.
Immediately ahead, there is horizontal resistance at 15700s.
Russell 2000 mini-index: Currently net short 66.9k, up 5.1k.
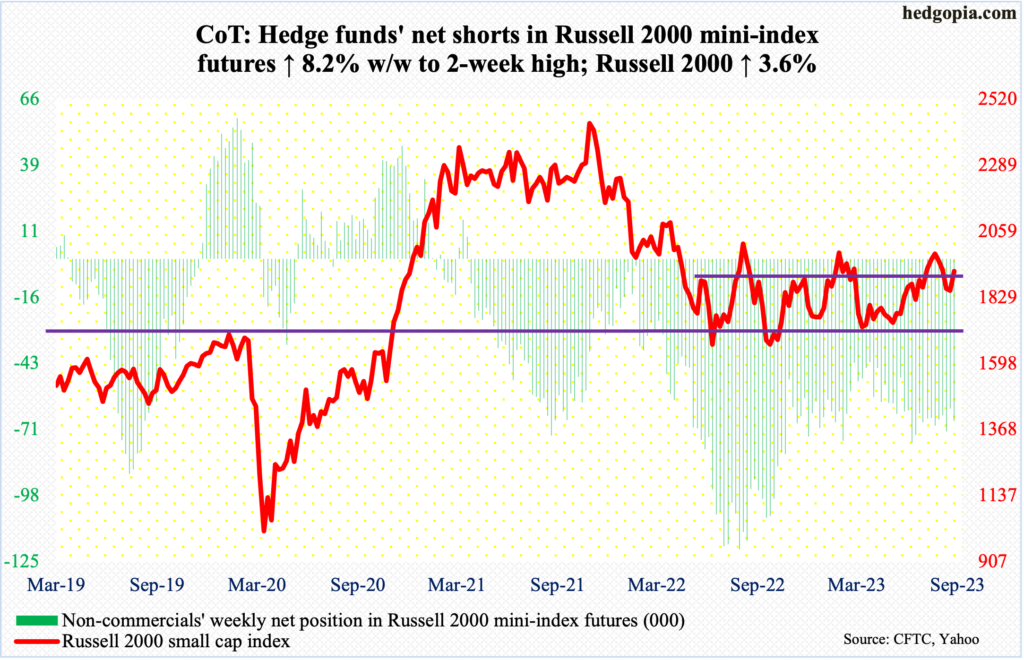
Small-cap bulls and bears are toughing it out for control of 1900.
The Russell 2000 had been rangebound between 1700 and 1900 since January last year. A breakout occurred on July 11 (this year). After that, the small cap index went on to rally to 2004, which was hit on July 31, but came up short of eclipsing the February (2023) high of 2007. The downward pressure since found support at 1830s twice last month – on the 18th and 25th – as bulls stepped up well before 1800 support was genuinely tested. This week, they rallied the Russell 2000 3.6 percent to once again reclaim 1900, closing at 1920. This gives them an opportunity to once again go after the February high.
US Dollar Index: Currently net long 2.8k, down 1.8k.
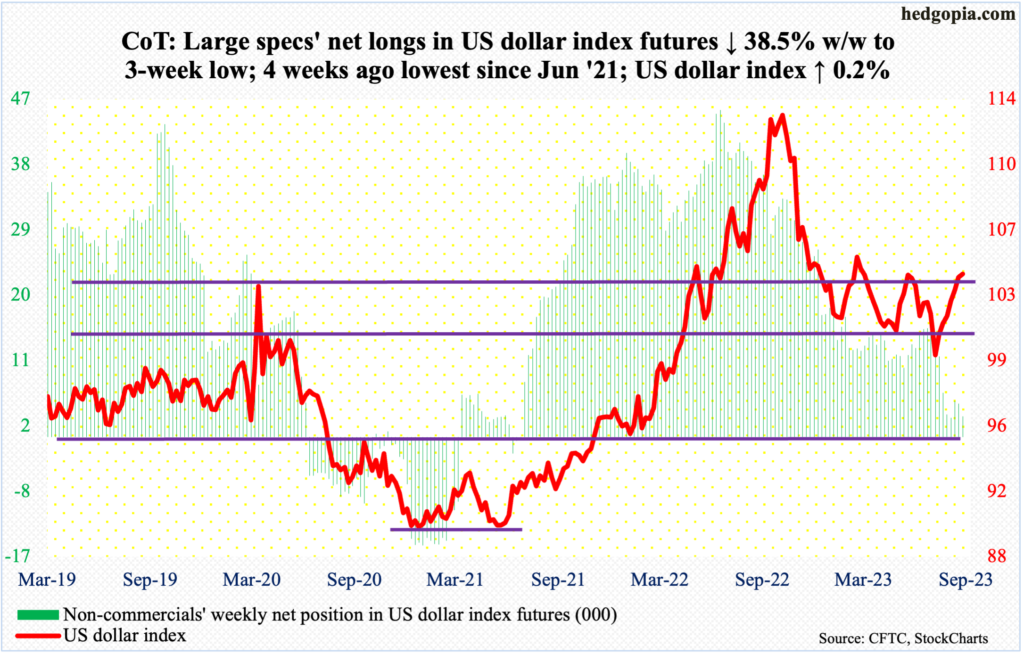
From the low of 99.22 reached on July 18, the US dollar index has now rallied for seven weeks straight. This week, it edged up 0.2 percent, with dollar bears making progress early on but bulls prevailing by the end of the week.
Intraday Wednesday, the index breached the 200-day by dropping to 102.86, but strength the next two sessions helped finish the week at 104.19. The average at 102.99 was defended.
Resistance at 103-104 goes back to at least December 2016. Six sessions ago, in a long-legged doji session, bulls were unable to hang on to the intraday high of 104.39. They now have another shot at it.
VIX: Currently net short 33.8k, up 6.1k.
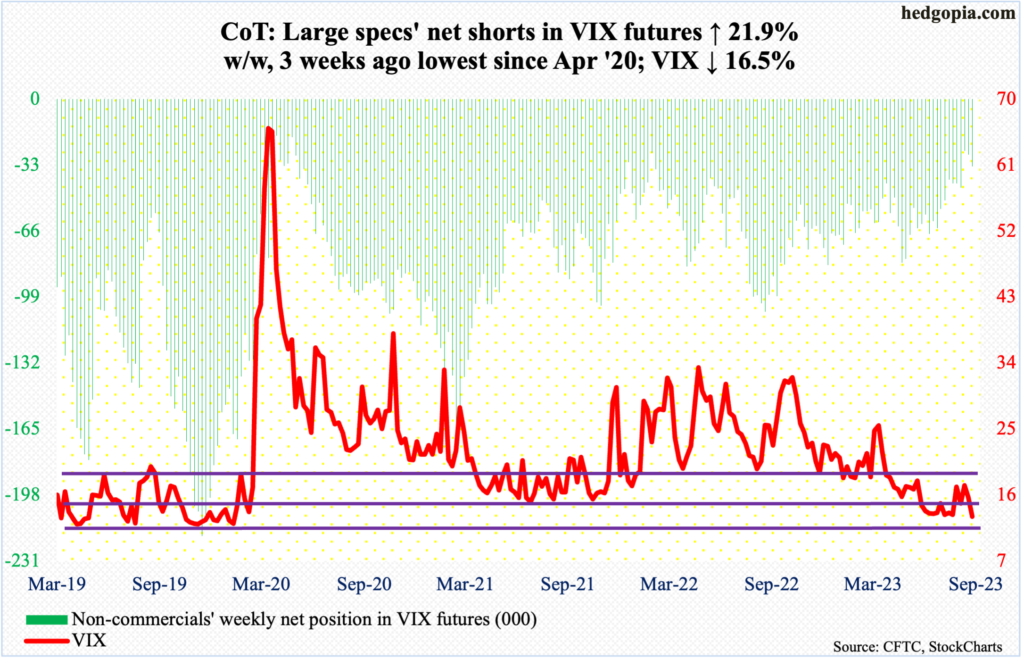
Volatility bulls were unable to reclaim the median on weekly RSI. The metric finished the week at 41.82, with strong support at mid- to high-30s. Amidst this, VIX at 13.09 is at/near decent support at 13, with June and July finding support at 12.73 and 12.74 respectively.
Elsewhere, the 10-day average of the CBOE equity-only put-to-call ratio ended the week at 0.752, having risen as high as 0.817 on Monday. This is elevated territory, which likely helped in this week’s 2.5-percent rally in the S&P 500 as bearish positions got unwound. Historically, the metric still has room for unwinding (more on this here). For this to happen, VIX probably needs to breach 13 and head lower, in turn helping equity bulls.
Thanks for reading!
