
Following futures positions of non-commercials are as of October 31, 2023.
10-year note: Currently net short 627.7k, up 64.3k.
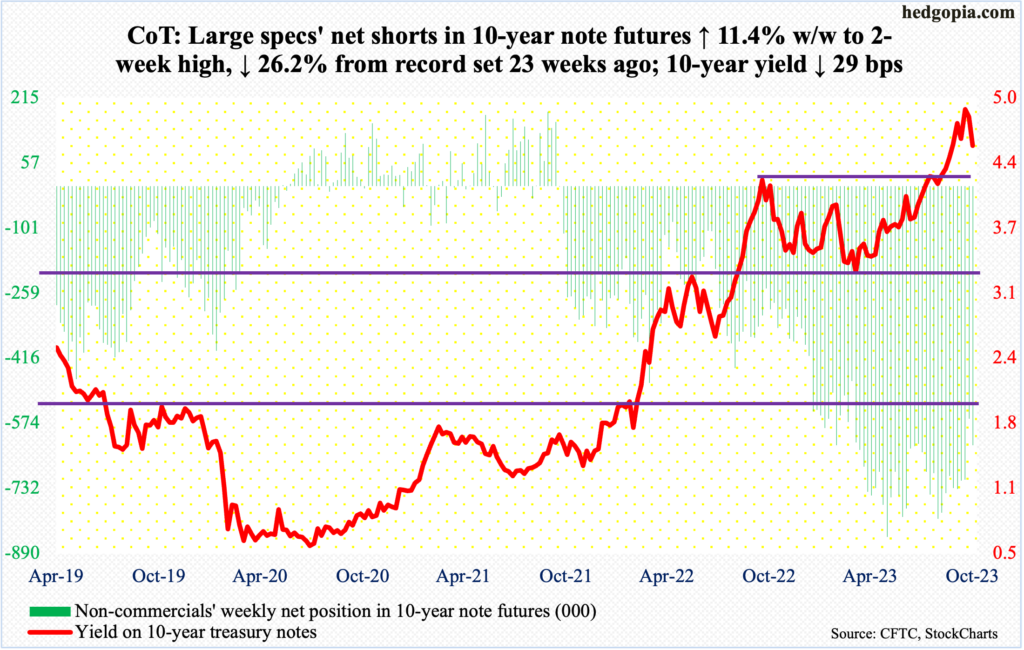
The 10-year treasury yield has peaked. For three consecutive sessions last month, it tried to unsuccessfully take out five percent, with the high of 4.997 percent recorded on the 23rd. This was the highest print since July 2007. Yields peaked at 5.32 percent in June back then, before coming under sustained pressure to eventually bottom at 0.40 percent in March 2020. In 2007, the 10-year peaked just before the global financial system came so close to unraveling.
These rates have come a long way. Early August last year, the notes were yielding 2.53 percent, and 1.13 percent in August 2021. Most recently, yields rallied sharply after breaking out of 4.3s on September 21st. Friday, the 10-year tagged 4.48 percent intraday to close at 4.58 percent. Odds favor that a breakout retest lies ahead. This will be the first test after the September breakout, so may not give way right away. But a breakdown is the path of least resistance in due course.
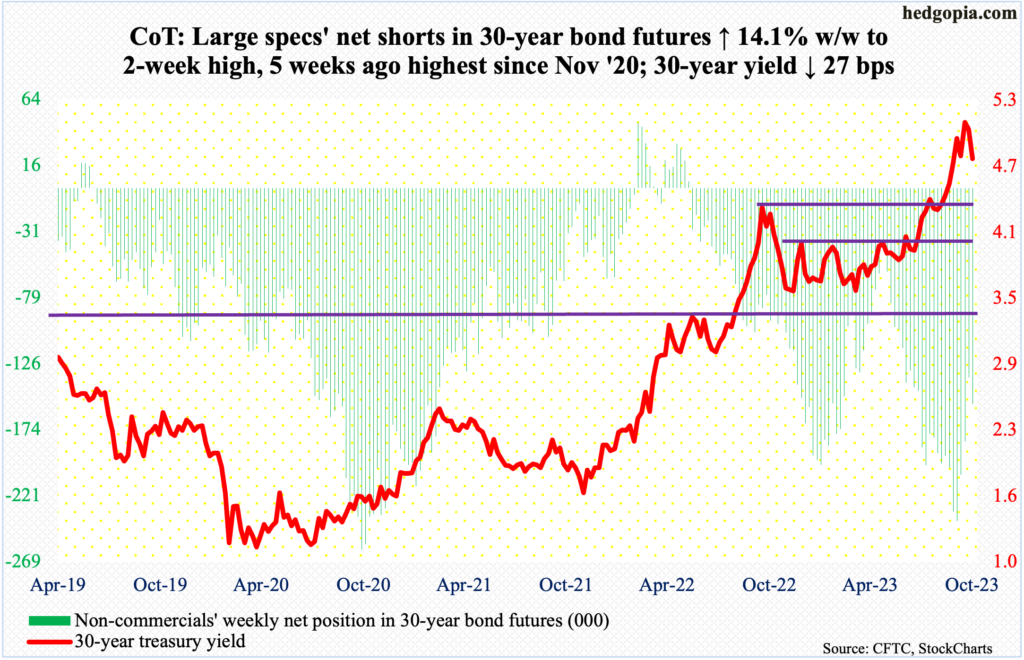
30-year bond: Currently net short 155.4k, up 19.1k.
Major US economic releases for next week are as follows.
Consumer credit (September) is due out Tuesday. In August, consumer credit fell 0.3 percent to a seasonally adjusted $4.97 trillion from July’s record $4.98 trillion. This was made up of revolving, up 1.2 percent to a record $1.28 trillion, and non-revolving, down 0.8 percent to $3.68 trillion from July’s record $3.71 trillion. From a year ago, they were up four percent, 10.6 percent and 1.9 percent, in that order.
Friday brings the University of Michigan’s consumer sentiment index (November, preliminary). In October, consumer sentiment tumbled 4.1 points month-over-month to 63.8, which was a three-month low. July’s 71.5 was a 21-month high.
WTI crude oil: Currently net long 241k, down 57.7k.
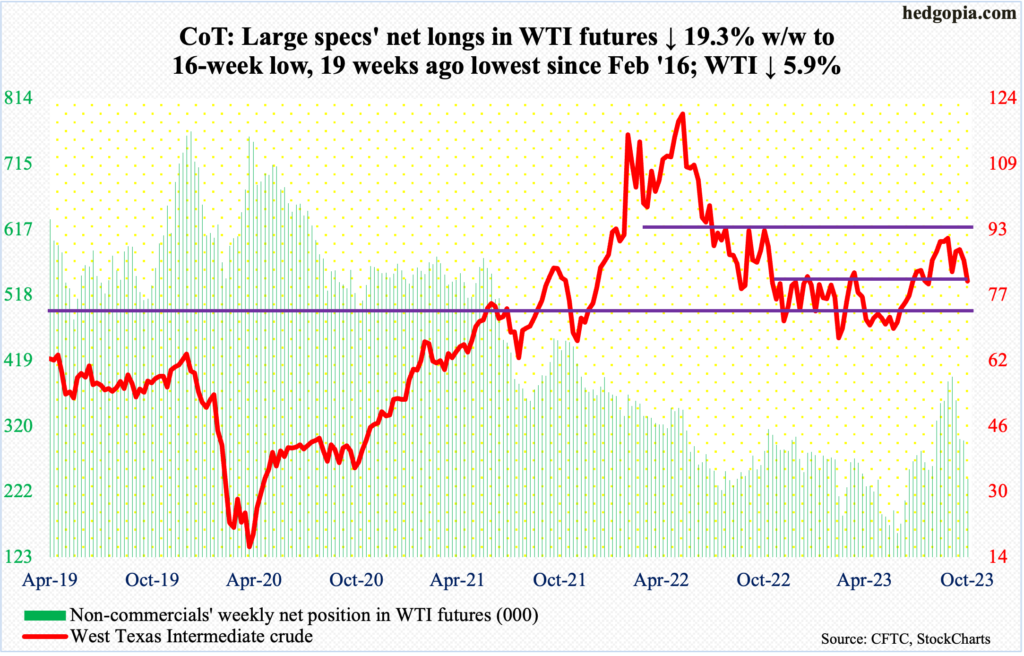
West Texas Intermediate crude has been pushed back under $81-$82 that formed the top end of a 10-point range since last December. The crude broke out of the range in late August, followed by a September 28th peak at $95.03. Earlier, WTI bottomed at $67.05 in June before beginning a multi-month rally.
This week’s 5.9-percent tumble to $80.51/barrel followed the breach last week of the 50-day moving average. The 200-day lies underneath at $78.23, and a test seems imminent in the sessions ahead.
In the meantime, as per the EIA, US crude production in the week to October 27th remained unchanged for four weeks in a row at a record 13.2 million barrels per day; this preceded four weeks of flat output at 12.9 mb/d. Crude imports increased 412,000 b/d to 6.4 mb/d. As did stocks of crude and gasoline, which respectively grew 773,000 barrels and 65,000 barrels to 421.9 million barrels and 223.5 million barrels. Distillates inventory, on the other hand, fell 792,000 barrels to 111.3 million barrels. Refinery utilization was down two-tenths of a percentage point to 85.4 percent.
E-mini S&P 500: Currently net long 4.3k, down 5.8k.
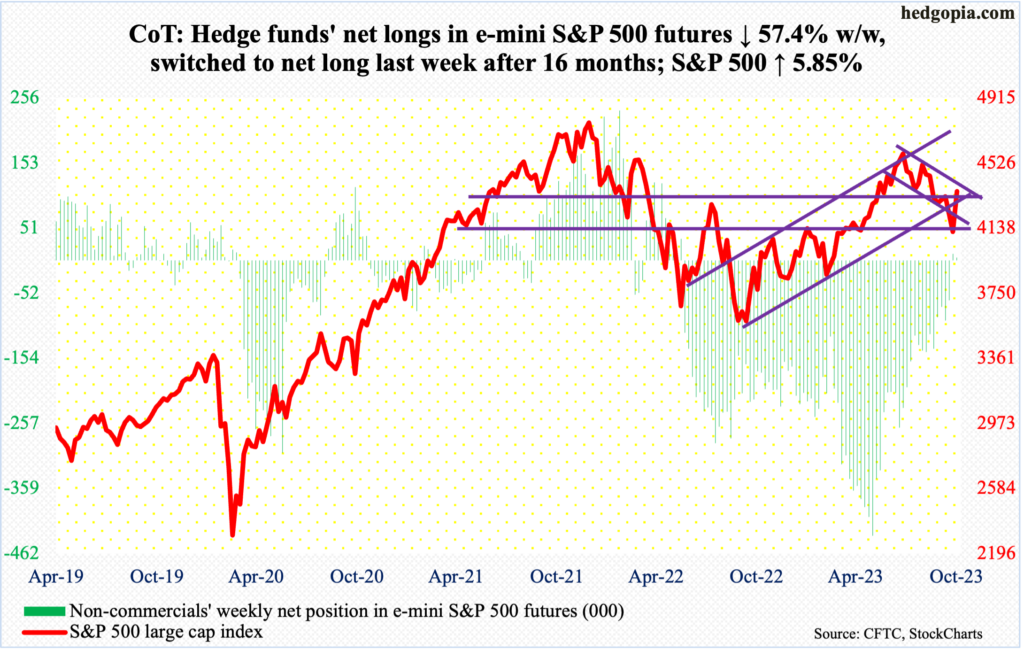
Equity bulls stepped up to the plate at a crucial level – emphatically. Last week, the S&P 500 breached several important levels, including dual channel support and the 200-day, closing at 4117.
After tumbling 27.5 percent from its all-time high (4819) posted in January last year, the large cap index bottomed last October at 3492. The subsequent rally stopped at 4100 several times, until it decisively yielded this May. That breakout has been defended in quite a fashion (more on this here). The S&P 500 shot up 5.9 percent this week to 4358.
With the move, the index once again sits just underneath the upper trendline of a descending channel from July when it peaked at 4607. The channel resistance is at 4400. The S&P 500 rallied in all five sessions this week, with Friday’s high 4374 drawing some offers. Next week is key.
Euro: Currently net long 85.4k, up 136.
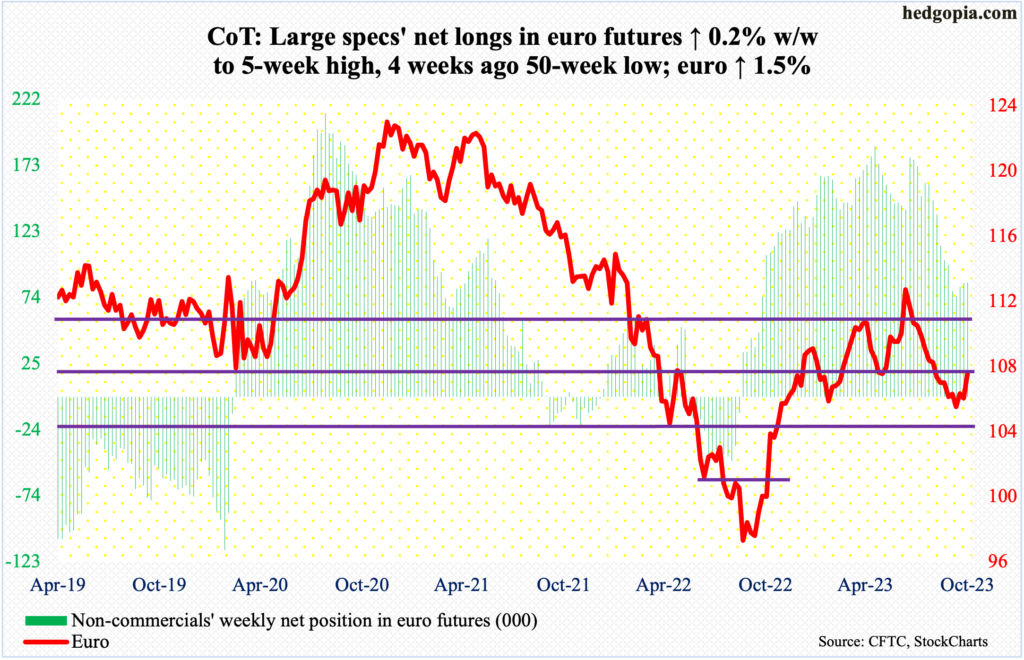
After weeks of giving out signs that it is trying to stabilize, the euro rose 1.5 percent to $1.0721 this week.
Earlier, the currency dropped 7.3 percent between the July 18th high $1.1270 and the October 3rd low of $1.0448, with the latter a successful test of straight-line support at $1.04-$1.05 that goes back to at least March 2015.
Several rally attempts last month repeatedly drew offers at $1.0630s, which was lost on September 25th. This – along with the 50-day – were reclaimed Friday.
Immediately ahead, the 200-day lies at $1.0810.
Gold: Currently net long 163.4k, up 14k.
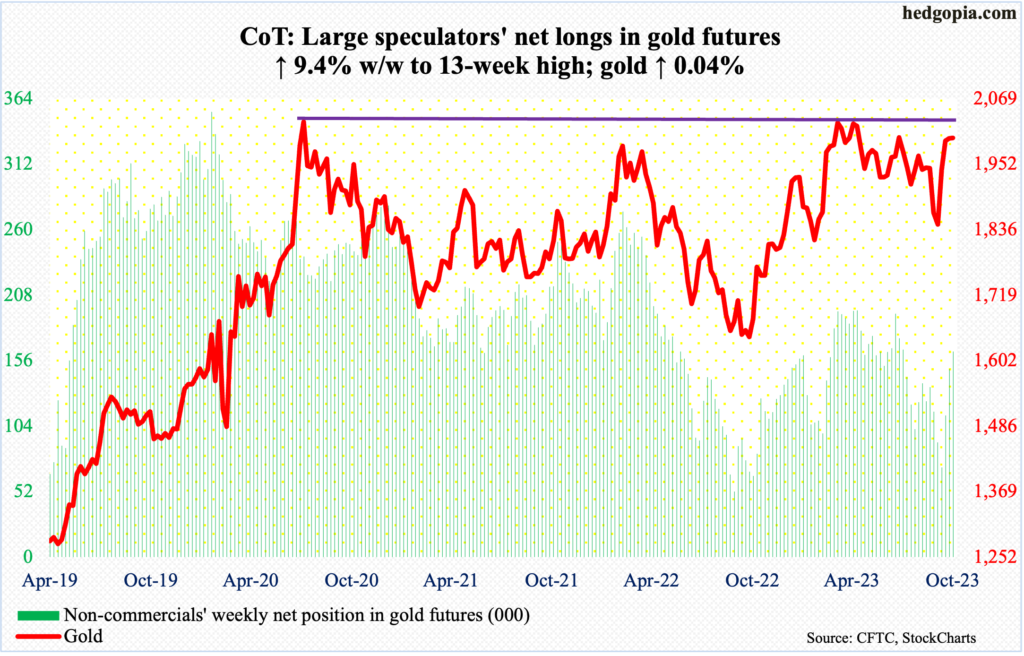
For the third week in a row, gold rallied past $2,000 intraweek, but failed to close above. This week, it opened Monday with a high of $2,018, but finished the week at $1,999. This was preceded by highs of $2,019 and $2,009 in the prior two weeks.
A break above $2,000 would have helped build on the metal’s recent momentum. Before the latest hesitancy around $2,000, gold just about went parabolic after bottoming at $1,824 early last month.
The yellow metal has failed at $2,080s at least twice since August 2020 when it reached an all-time high of $2,089, with a print of $2,079 in March last year and $2,085 in May this year. For another attack on this roadblock, gold bugs probably need to regroup at a lower price point.
Nasdaq 100 index (mini): Currently net long 6.7k, up 4k.
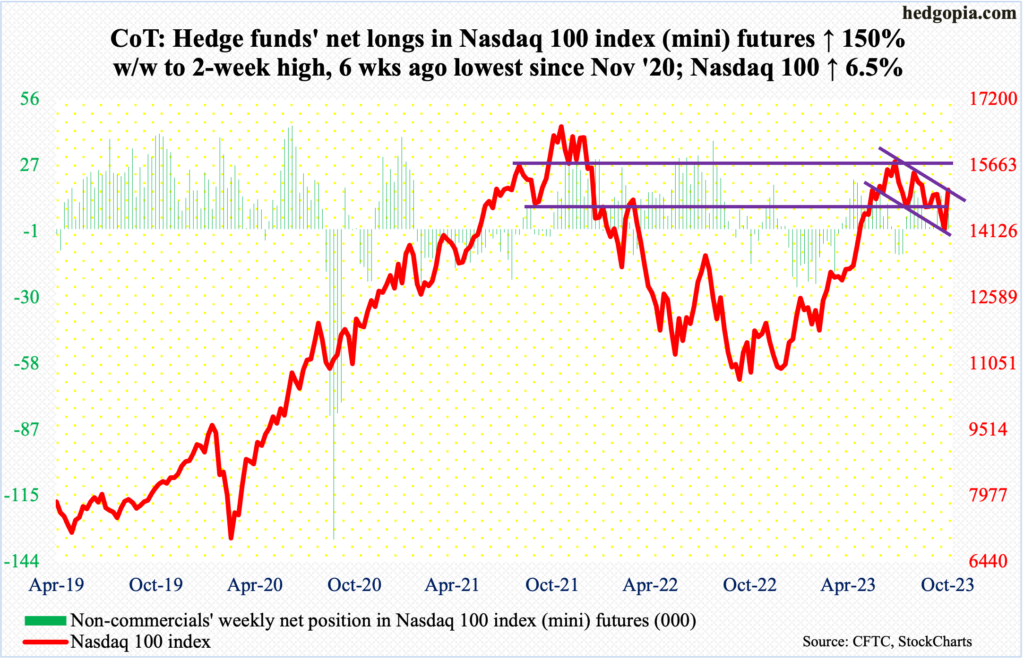
After three months of decline, November has gotten off strong. The month is only three sessions old, and the Nasdaq 100 is up 4.8 percent. For the week, the tech-heavy index was up 6.5 percent, more than recovering the prior two week’s losses.
Momentum was strong. But a crucial test lies ahead. At 15099, the Nasdaq 100 closed right at the upper trendline of a descending channel from July when it retreated after touching 15932, with Friday’s high of 15150 kissing that resistance and attracting sellers.
In the meantime, the daily RSI closed at 58.04. High-50s was lost in early August, and several attempts since to reclaim the level failed at that resistance. For the metric to succeed this time, the above-mentioned channel resistance needs to break.
Russell 2000 mini-index: Currently net short 39.4k, down 4.7k.
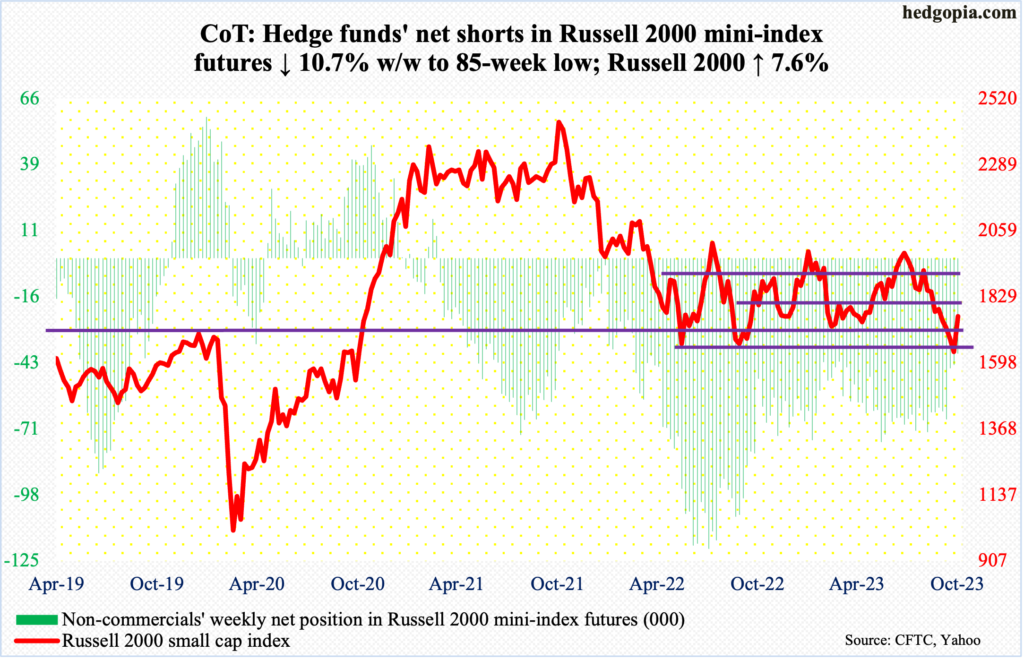
Small-cap bulls scored big this week.
The Russell 2000 peaked in November 2021. Beginning the following January, the small-cap index pretty much traded in a range between 1700 and 1900. In June and October last year, it dropped out of the range but only to find bids waiting at 1640s.
Last week, the index closed at 1637. This week, the first three sessions saw the Russell 2000 again dropping to 1630s and 1640s, but the bulls held firm. By Friday’s close, the index was at 1761. The mid-point of the above-mentioned range rests at 1800, which probably acts as a magnet for now.
US Dollar Index: Currently net long 19k, down 686.
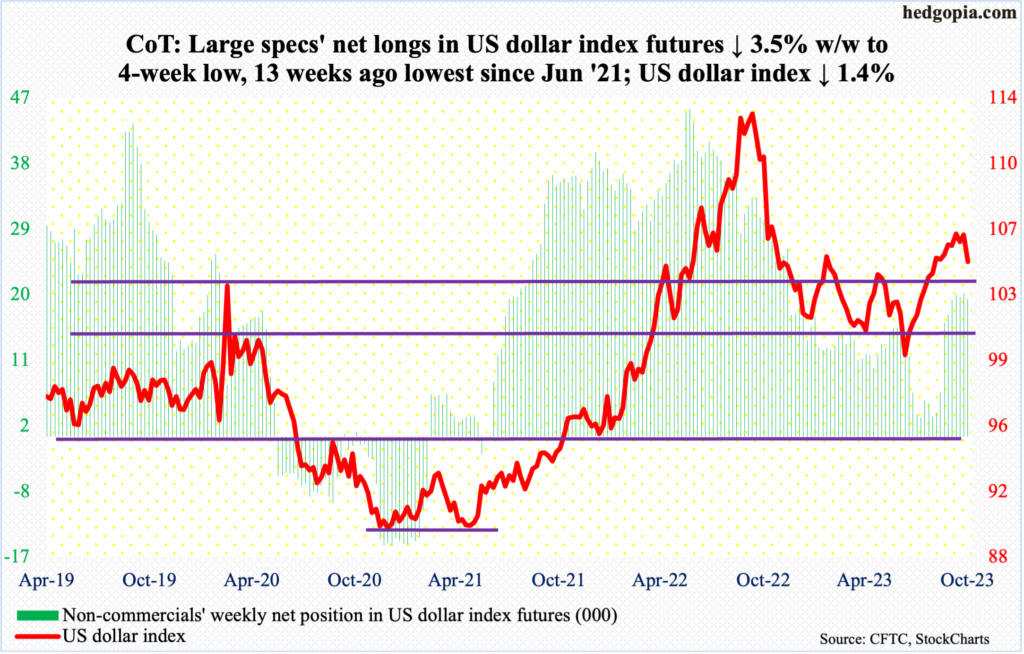
For five weeks leading up to this week, the US dollar index wore a flattish look with the lows congregated around 105.10s and the highs around 106.50s. This week, it broke to the downside, closing at 104.86.
Previously, the index bottomed at 99.22 on July 18th, having peaked last September at 114.75.
This week’s action – particularly Friday’s 1.1-pecent decline slicing through the 50-day – suggests the index wants lower prints. Support at 103-104, which goes back to at least December 2016, is a make-or-break for dollar bulls.
VIX: Currently net short 14k, down 7.6k.
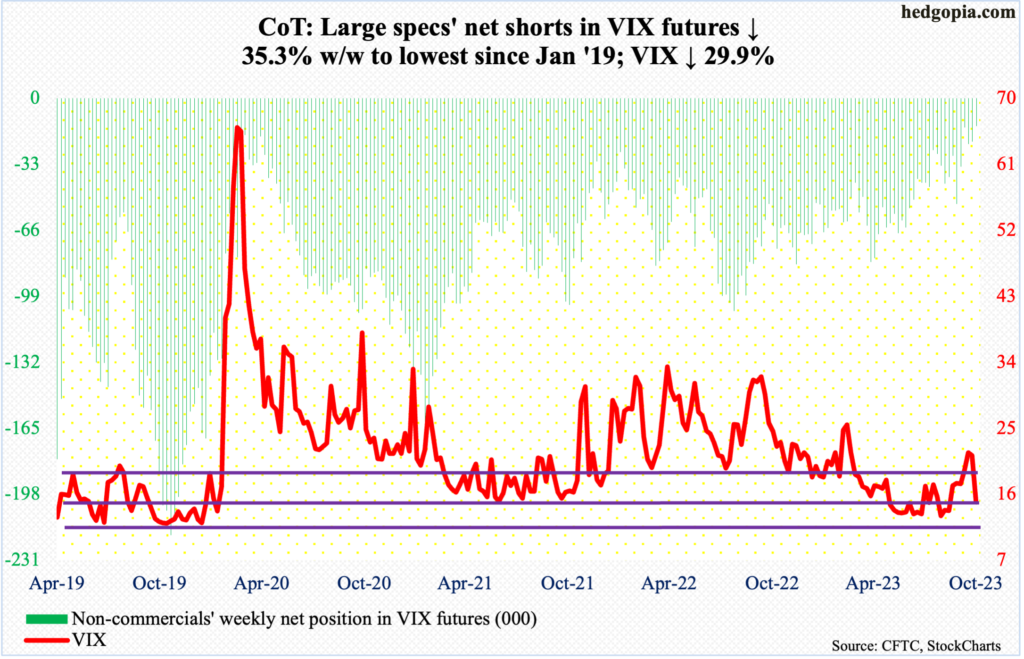
VIX formed a massive bearish marubozu on the weekly this week, losing 6.36 points to 14.91. There is horizontal support at 15, and the daily is beginning to get oversold. If 15 does not hold, risks grow the volatility index wants to go toward 13, or just south of it. Prior to a rally in VIX in September and October, it routinely found support at that level in June through September.
Thanks for reading!
