
Following futures positions of non-commercials are as of January 23, 2024.
10-year note: Currently net short 784.7k, down 104.7k.
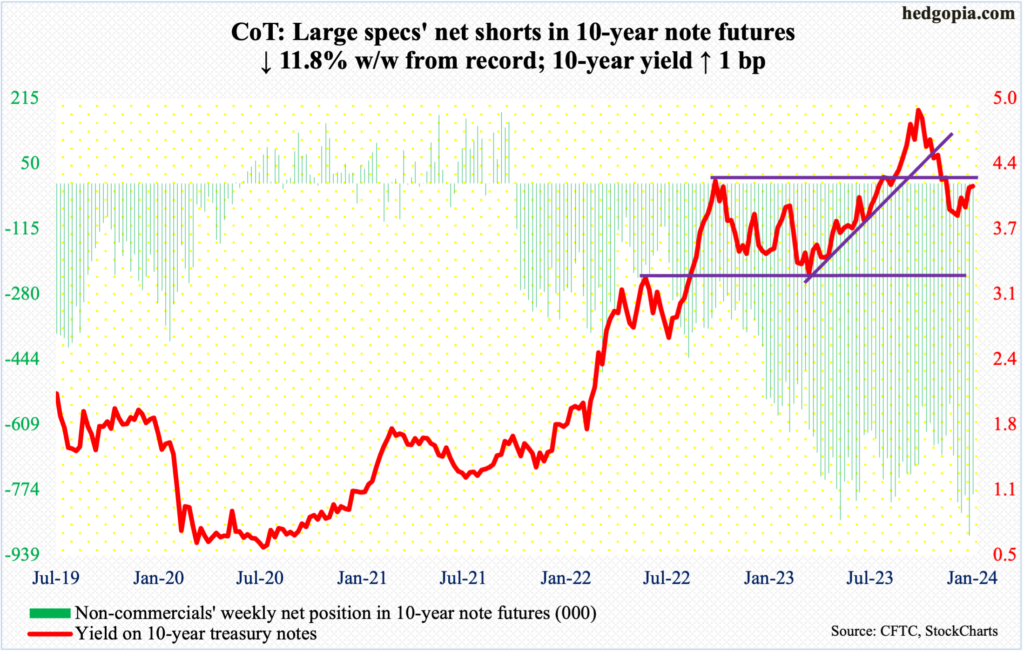
Next week, the FOMC meets. This is the first meeting this year, and seven more – the scheduled ones – remain. The policy-setting body is certain to leave the rates unchanged at a range of 525 basis points to 550 basis points, having been raised from zero to 25 basis points from March 2022.
So, the key question next week revolves around the outlook. In the prior meeting last month – on December 13th – the statement already suggested the next move will be lower, with the dot plot indicating three 25-basis-point cuts this year, up from two during the September meeting. Upon hearing this dovish pivot, the futures market immediately raised the expected cuts this year from four to six, with the earliest occurring in March.
Fast forward to this week, these traders are no longer thinking a March cut is probable, with odds having dropped to below 48 percent. At the same time, they continue to price in five cuts, ending the year between 400 basis points and 425 basis points. This is unrealistic, particularly considering that the economy continues to churn out stronger-than-expected numbers, including the fourth-quarter GDP figures that were released this week.
This is what Chair Jerome Powell will try to drive home next week – that the central bank is not going to acquiesce to markets’ starry-eyed demands. Ratcheting down these expectations can have repercussions for a whole host of assets, not the least of which are both equities and bonds.
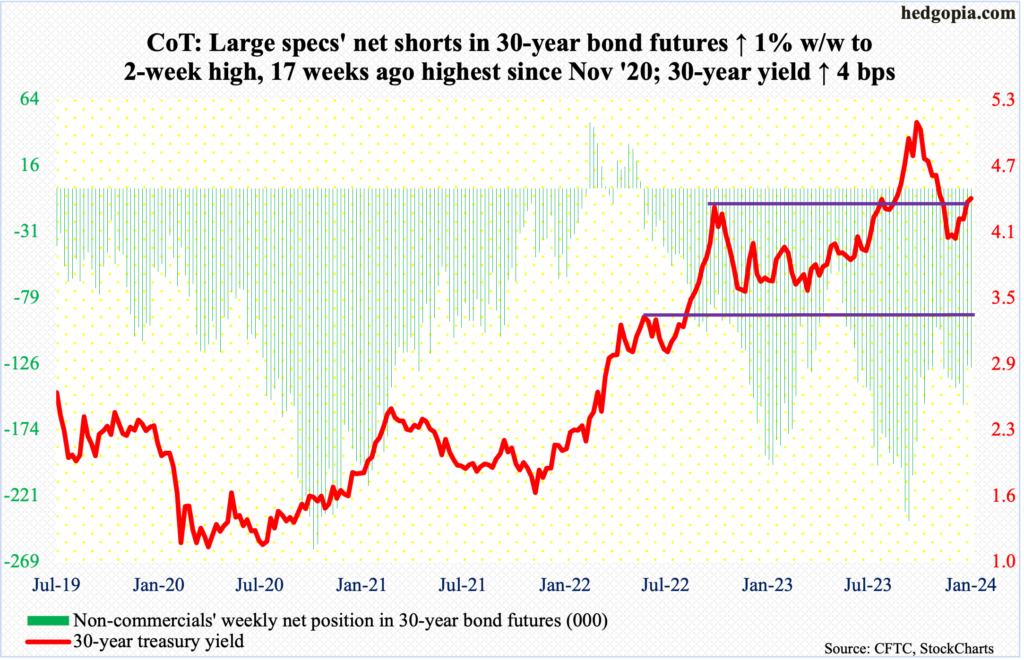
30-year bond: Currently net short 129k, up 1.3k.
Major US economic releases for next week are as follows.
The S&P Case-Shiller Home Price Index (November) and JOLTs job openings (December) are scheduled for Tuesday.
Nationally, home prices rose 4.8 percent year-over-year in October. This was the best showing in 10 months. In three of those months – April through June – prices fell slightly. Prices peaked in March 2022 at a record 20.8 percent.
In November, non-farm job openings fell 62,000 month-over-month to 8.8 million, which is the lowest since March 2021. Openings are down 3.2 million from the record 12 million posted in March 2022.
The employment cost index (4Q23) is due out Wednesday. Private-industry compensation grew at an annual rate of 4.3 percent in the September quarter. This is still a decent pace but has been decelerating since 2Q22 when the metric rose 5.5 percent – a 38-year high.
Thursday brings labor productivity (4Q23) and the ISM manufacturing index (January).
Non-farm output per hour jumped at an annualized rate of 5.1 percent in 3Q23, which was the best growth rate in three years.
Manufacturing activity in December rose seven-tenths of a percentage point m/m to 47.4 percent. This represents the 14th month of contraction.
Payrolls (January), durable goods orders (December, revised) and the University of Michigan’s consumer sentiment index (January, final) come out on Friday.
In 2023, the economy averaged a monthly creation of 225,000 non-farm jobs. This is down from the monthly average of 399,000 in 2022 and 606,000 before that in 2021.
December orders for non-defense capital goods ex-aircraft – proxy for business capex plans – rose 0.3 percent m/m to a seasonally adjusted annual rate of $74.3 billion, which is a record.
January’s preliminary reading showed consumer sentiment shot up 9.1 points m/m to 78.8 – a 30-month high. In June 2022, sentiment fell to a record low 50.
WTI crude oil: Currently net long 221.3k, up 49.2k.
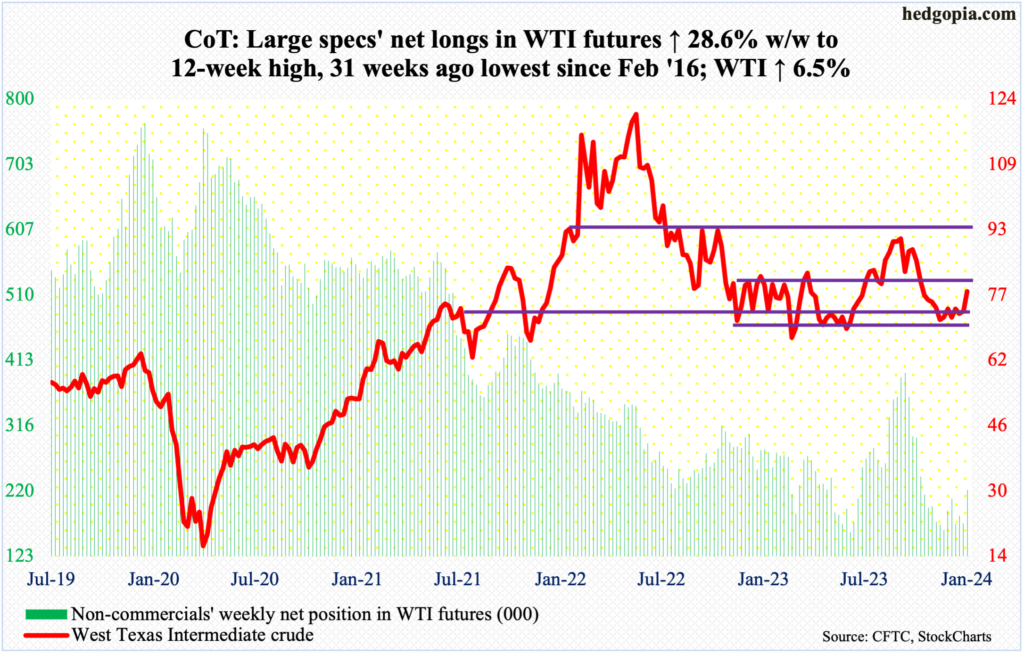
As soon as the week began, oil bulls claimed the 50-day moving average, which is now flat. By Friday, the 200-day ($77.59) – also flat – was captured, albeit by a touch. For the week, West Texas Intermediate crude rallied 6.5 percent to $78.01/barrel. This followed a back-to-back weekly spinning top and a sideways action for seven weeks, during which it spent most of its time around the low end of a 13-month range between $71-$72 and $81-$82.
WTI peaked last September at $95.03, having rallied from last June’s low of $67.05. On December 13th, it ticked $67.71 intraday before bottoming. This price point is crucial. As things stand, the path of least resistance is toward the upper bound of the aforementioned range.
In the meantime, as per the EIA, US crude production in the week to January 19th tumbled one million barrels per day week-over-week to 12.3 mb/d. Crude imports, too, decreased 1.8 mb/d to 5.6 mb/d. Stocks of crude and distillates declined as well – respectively down 9.2 million barrels and 1.4 million barrels to 420.7 million barrels and 133.3 million barrels. Gasoline inventory, on the other hand, grew 4.9 million barrels to 253 million barrels. Refinery utilization dropped 7.1 percentage points to 85.5 percent.
E-mini S&P 500: Currently net short 189.5k, up 20.2k.
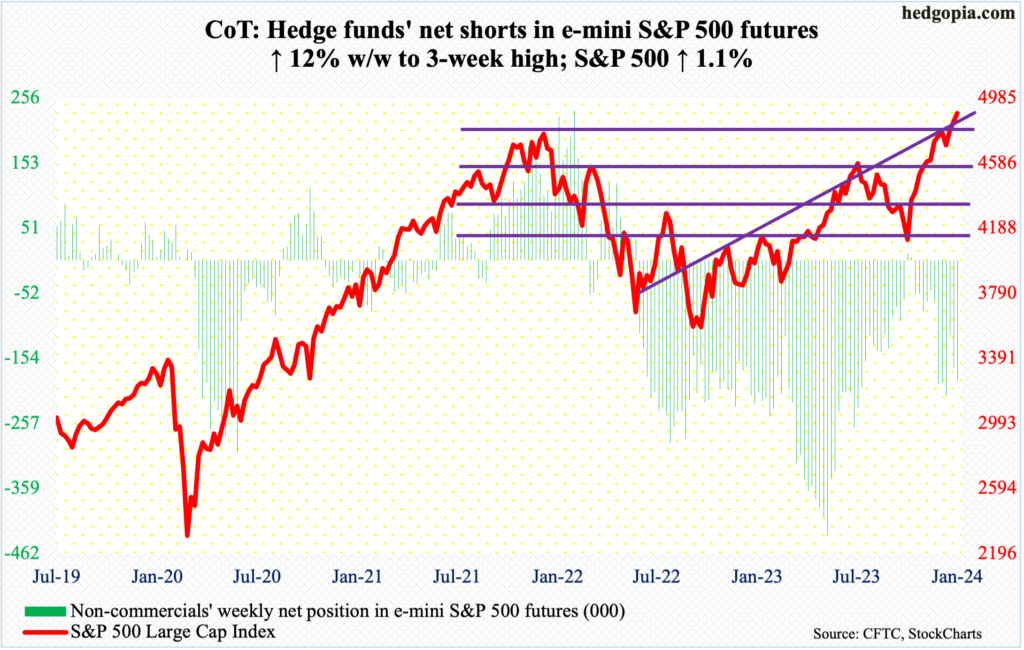
No sooner did 4800, which had held down the S&P 500 since late December, give way last week than it rallied to 4900 in no time. On Friday, the large cap index tagged 4907, before giving back those gains to end the session down 0.1 percent to 4891. Nevertheless, it rallied 1.1 percent for the week – its third consecutive up week and 12th in 13.
Last Friday, when 4800 cracked, the index also surpassed the prior high of 4819 from January 2022. A breakout retest is just a matter of time and will be healthy, as this will help determine how genuine the breakout is and if recent positive trends seen in margin debt and equity flows are here to stay (more on this here).
For now, upward momentum is strong, with the daily RSI over 72 and the weekly over 70. This also makes the index susceptible to an unwinding of the extremely overbought condition it is in.
Short-term support is at 4860s, followed by the important 4800-4810s.
Euro: Currently net long 88.3k, down 15.8k.
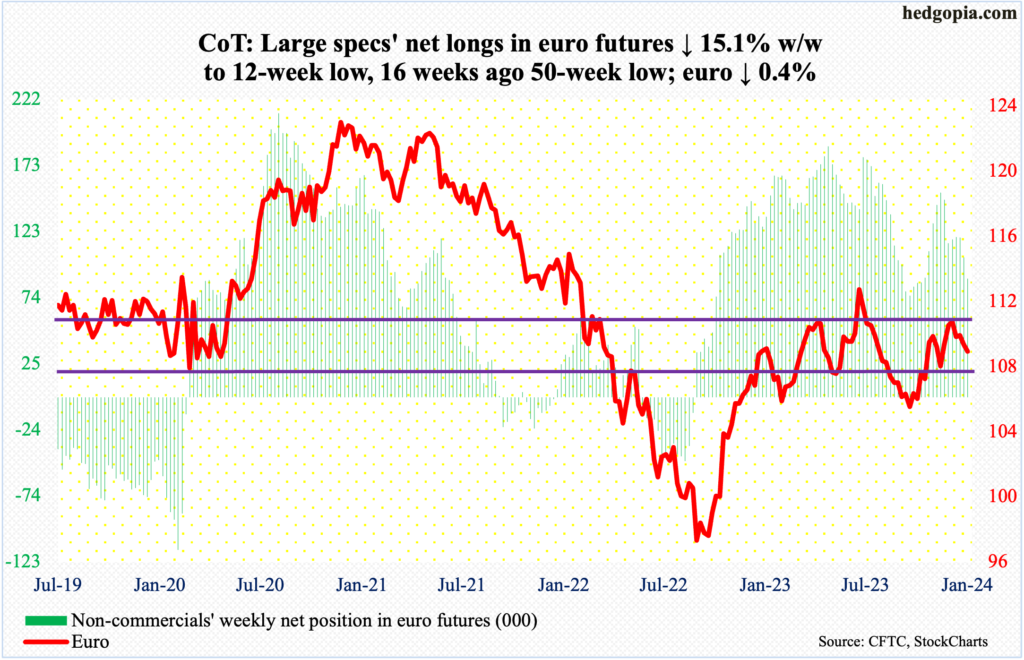
Bulls tried to take advantage of the oversold condition on the daily but were unable to keep the gains. At Wednesday’s high of $1.0932, the euro was up 0.3 percent for the week, but when it was all said and done, it ended up going down by 0.4 percent. The 50-day at $1.0913 proved tough.
This week’s action follows three consecutive spinning tops on the weekly and a shooting star before that. On December 27th, the currency tagged $1.1125, which marked the end of the rally that began on October 3rd at $1.0448. Before that, the euro came under pressure last July after ticking $1.1270.
Immediately ahead, on condition that $1.0820s is not breached, there is room for a rally.
Gold: Currently net long 169.5k, down 10.4k.
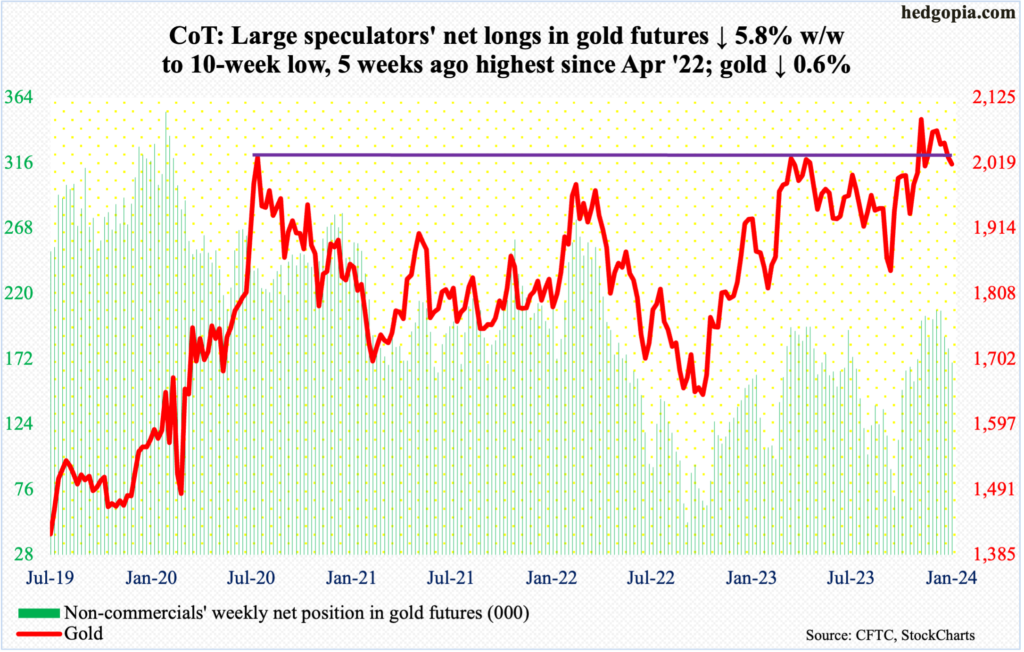
Gold bugs just cannot get it going. Several attempts this week to recapture the 50-day fell short. Gold, which fell 0.6 percent this week to $2,017/ounce, remains between the average ($2,031) and the 200-day ($1,978).
Non-commercials, in the meantime, reduced net longs in gold futures to a 10-week low. They held 207,718 contracts in the week to December 26th. This week, holdings stood at 169,474, which remains sizable. These traders began to reduce their long exposure after the metal failed to reclaim $2,080s.
Gold rose as high as $2,152 on December 4th but reversed to close at $2,042; resistance at $2,080s held. This has proven to be an important price point. In August 2020, the yellow metal posted a new all-time high of $2,089 and retreated. The reversal occurred again in March 2022 when it printed $2,079 and in May last year when $2,085 was tagged, followed by rejection late last month and early this month.
If it is any consolation to the bulls, $2,000 is attracting bids, including this week.
Nasdaq 100 index (mini): Currently net long 33k, down 3.5k.
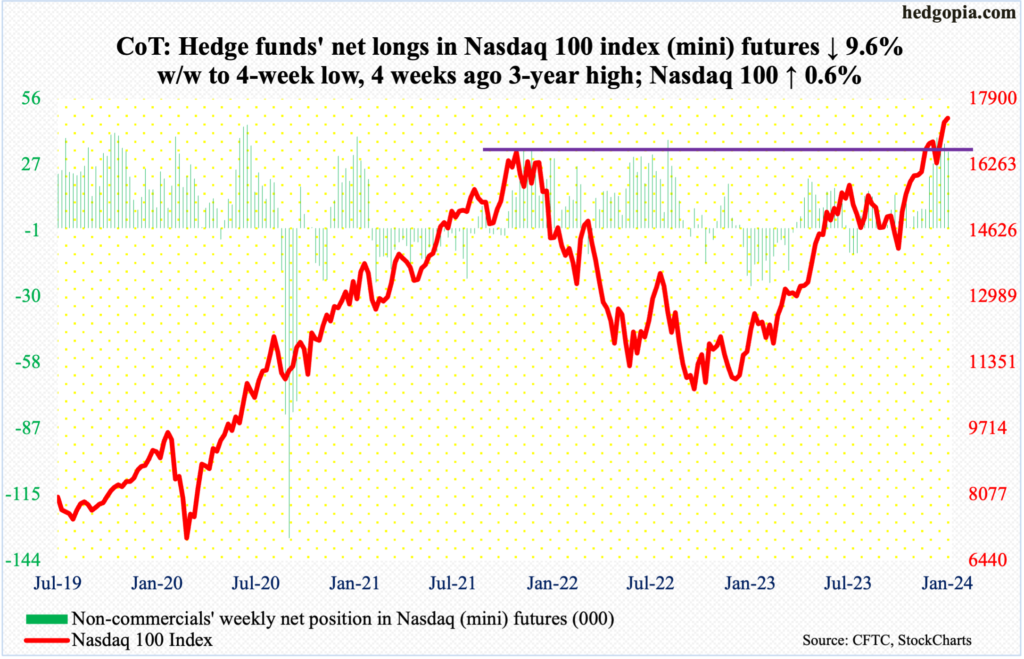
Ahead of next week’s December-quarter results from Apple (AAPL), Microsoft (MSFT), Google owner Alphabet (GOOG), Amazon (AMZN) and Facebook owner Meta (META), the Nasdaq 100 formed a weekly spinning top, with an intraday high of 17665 and a close of 17421.
This week, of the majors, results from Netflix (NFLX) drew positive reaction, while those from Tesla (TSLA) and Intel (INTC) were treated harshly. The problem for these stocks, including the five reporting next week, is that they have had massive rallies the past three months. From last October’s low, the Nasdaq 100 is up 25.7 percent, and 69.2 percent from the October 2022 low.
Shorts are likely to use the earnings reports to get active (more on this here). In fact, this week’s candle suggests it has begun.
Russell 2000 mini-index: Currently net short 6.2k, up 20.4k.
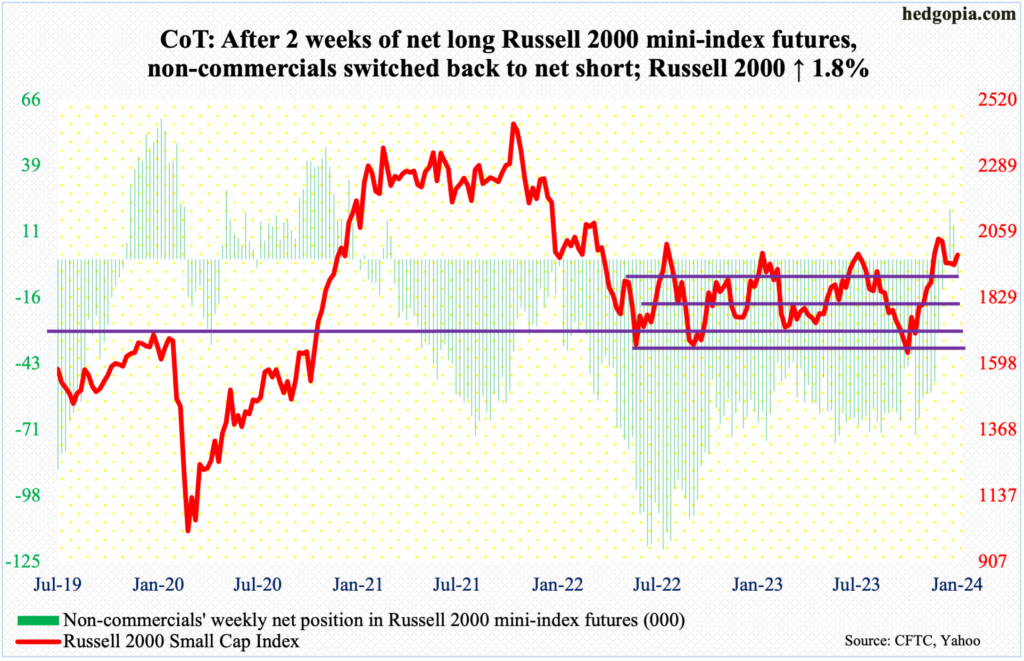
Non-commercials switched back to net shorts in Russell 2000 mini-index futures. Three weeks ago, having stayed net short uninterrupted for 146 weeks, they went net long. This only lasted a couple of weeks.
They have probably decided that the December 27th high of 2072 in the cash is unlikely to get surpassed anytime soon. Earlier on December 13th, the Russell 2000 broke out of a 200-point range between 1900 and 1700, which had been in place since January last year. A measured-move target of the breakout came to 2100, which was just about hit two weeks later.
This week, the small cap index did rally 1.8 percent but was also denied at 2000 twice – on Tuesday and Wednesday. It now increasingly looks like it is once again headed for a breakout retest at 1900, which already occurred in the week before – successfully.
US Dollar Index: Currently net long 1.6k, up 347.
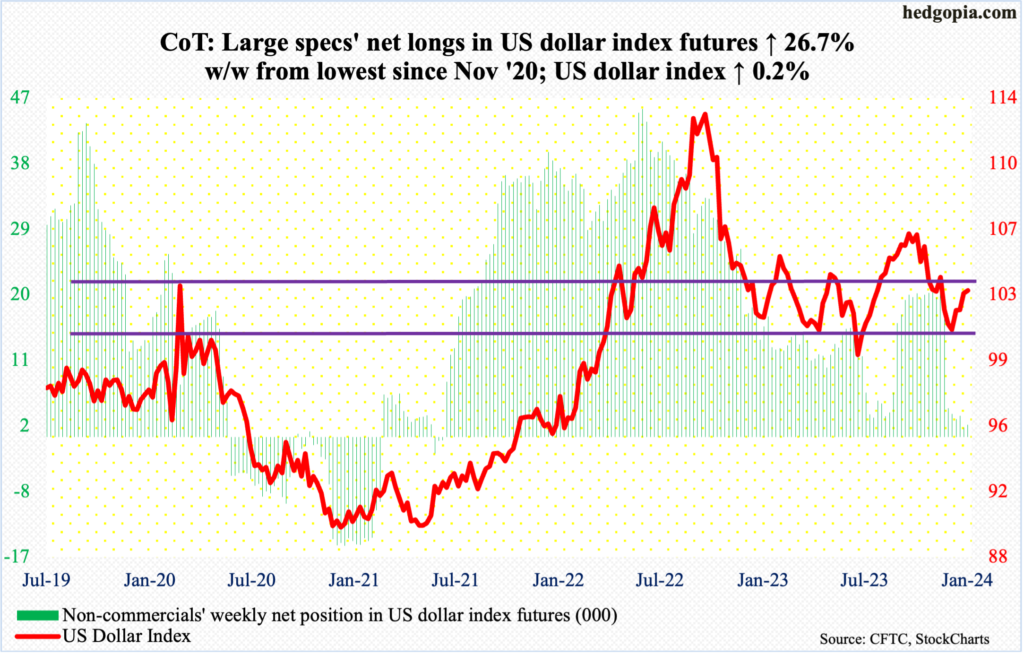
The weekly RSI ended this week at 49.25. Inability to take out the median – likely – should open the door to lower prints.
Having said that, the US dollar index (103.23), up 0.2 percent this week, did enjoy its fourth up week in a row. Five weeks ago, it bottomed at 100.32 on December 28th.
Before that, the index peaked on October 3rd at 107.05 and began to really come under pressure early November. Post-Fed pivot on December 13th, it sliced through horizontal support at 103-104 as well as the 200-day. It is currently trapped between the average (103.29) and the 50-day (102.75).
As things stand, odds favor a breach of the 50-day in the sessions ahead.
VIX: Currently net short 49.2k, up 5.4k.
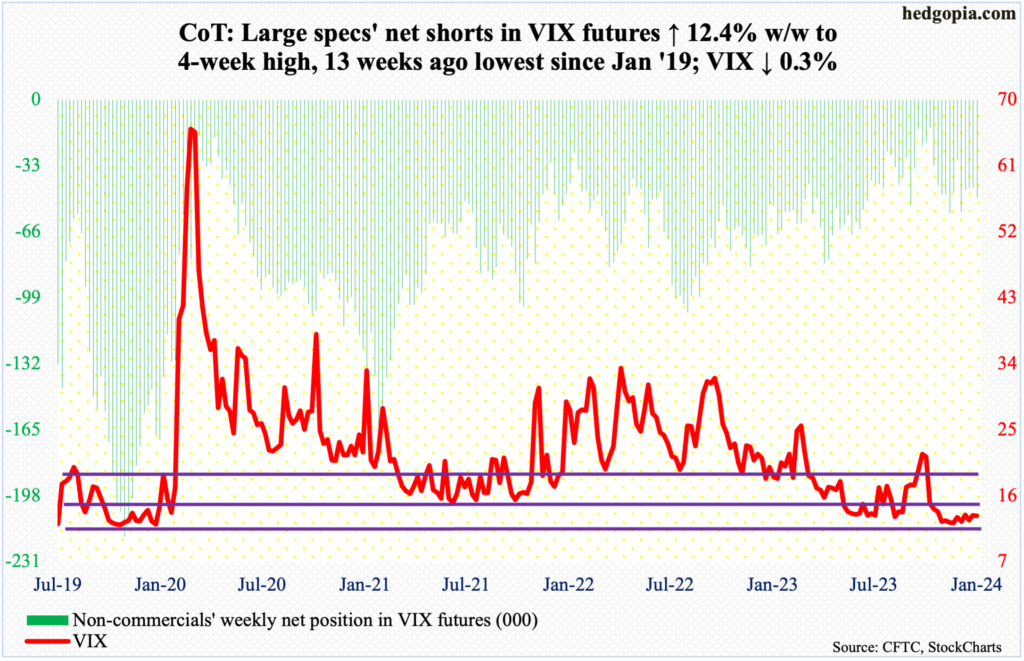
On December 12th – the day before the Fed made the pivot – VIX tagged 11.81 intraday and gradually headed higher, eventually reaching 15.40 on the 17th this month. Volatility bulls were unable to hang on to that high but should like the fact that since that low a month and a half ago the index has made higher lows, with a low of 12.41 this week occurring on Wednesday; the week closed at 13.26, only down 0.04 points. Last week, too, VIX rallied – hand in hand with the S&P 500, which in and of itself is rare.
Volatility likely gets bid up in the sessions ahead.
Thanks for reading!
