
Following futures positions of non-commercials are as of March 12, 2024.
10-year note: Currently net short 603.5k, down 109.7k.
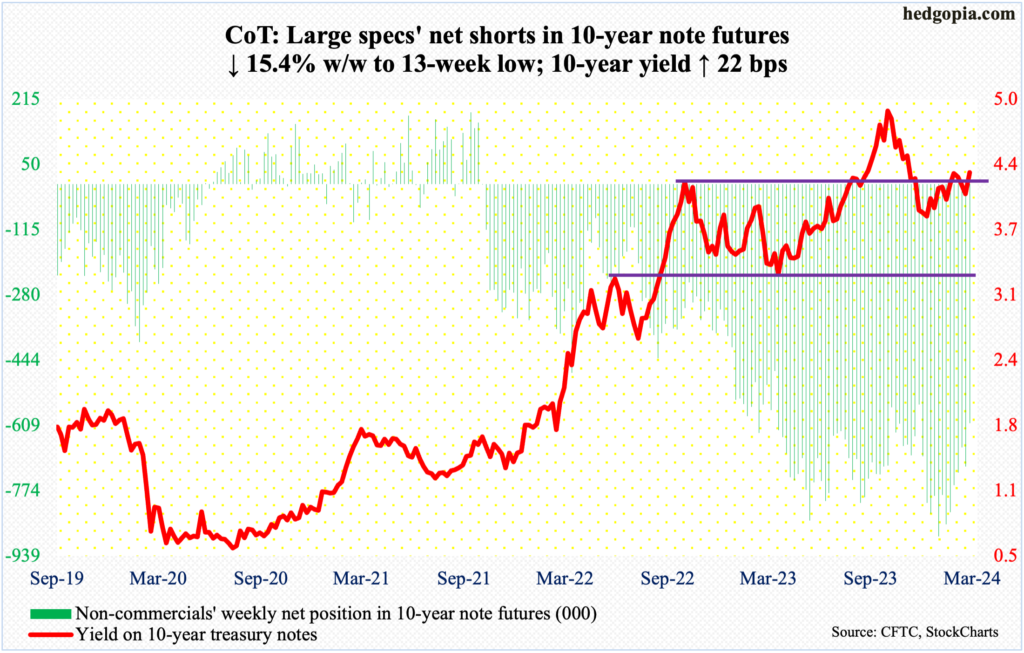
Fed funds futures traders are sticking with their outlook for three 25-basis-point cuts this year, with the first cut taking place in June. Post-FOMC meeting next week – slated for Tuesday-Wednesday – this likely gets priced out.
This week, both the CPI (consumer price index) and PPI (producer price index) for February came in hotter than expected. The underlying trend in consumer inflation remains down but it is also proving stickier than these traders were probably expecting.
The December FOMC dot plot raised members’ rates forecast from two at the September meeting to three. Odds favor they will go back to expecting two cuts next week – or maybe even one in a worse-case scenario.
Thus far, there are no visible signs of adverse impact of the 525-basis-point tightening the Fed engineered between March 2022 and July last year. If the economy needs no help, why throw more liquidity into the system? Even some FOMC members are beginning to toy with this question.
The futures traders, who not too long ago were pricing in six to seven cuts this year, have adjusted their outlook downward – to be on par with the dot plot. But it looks like they will be forced to adjust again – down, of course.
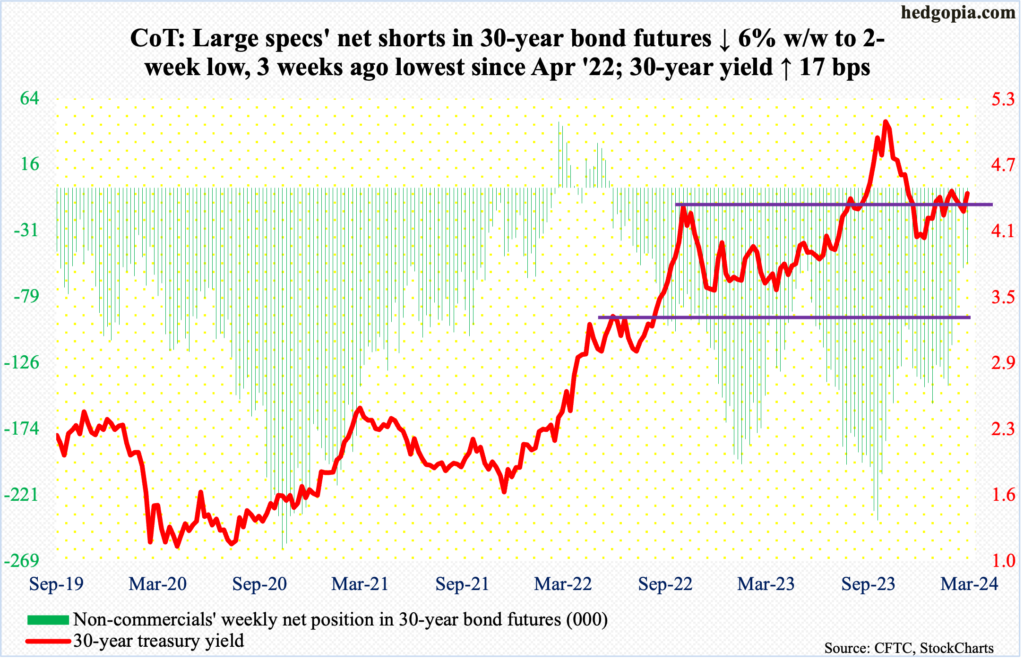
30-year bond: Currently net short 54.5k, down 3.5k.
Major US economic releases for next week are as follows.
The NAHB Housing Market Index (March) is on dock for Monday. Homebuilder optimism firmed up four points month-over-month in February to 48, which was a six-month high.
Housing starts (February) come out Tuesday. January starts tumbled 14.8 percent m/m to a seasonally adjusted annual rate of 1.33 million units – not too far away from last August’s 1.31 million, which was the lowest since June 2020.
Thursday brings existing home sales (February). Sales in January increased 3.1 percent m/m to four million units (SAAR) – a five-month high.
WTI crude oil: Currently net long 282.5k, down 10.4k.
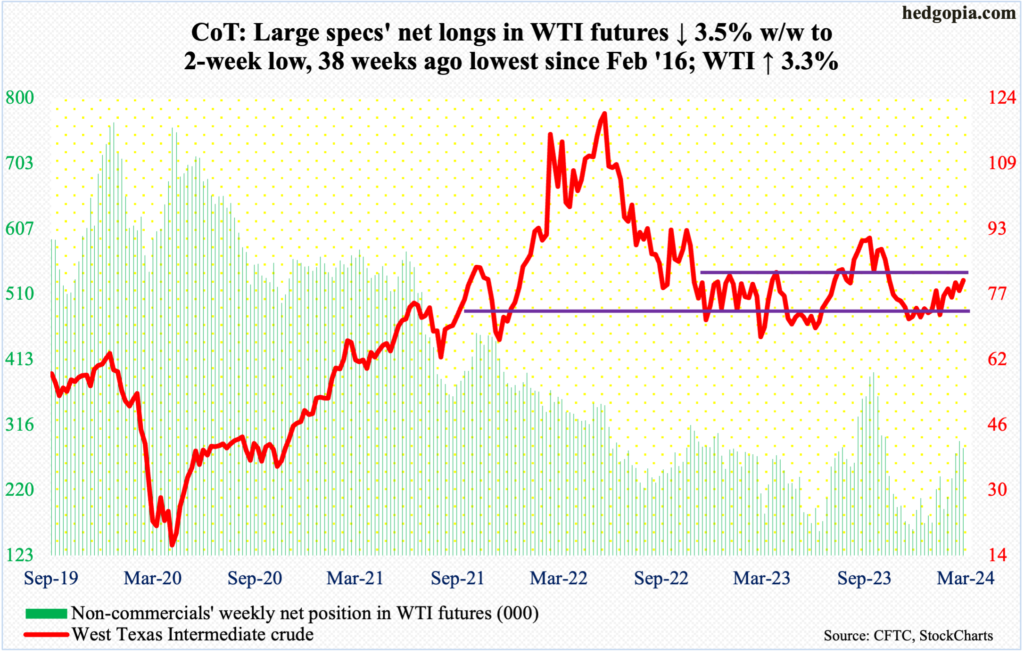
Oil bulls maintained their onslaught at the upper end of an 18-month range between $71-$72 and $81-$82. Intraday Thursday, West Texas Intermediate crude tagged $81.62 before retreating to end the week up 3.3 percent to $80.58/barrel.
From the bulls’ perspective, the good thing is that the crude has trended higher since bottoming at $67.71 last December. Thursday’s high was the highest since early November last year. WTI remains above both the 50- and 200-day, with the former rising and the latter flattish. At this rate, a golden cross between the averages is just a matter of time.
With that said, the range resistance mentioned previously is standing firm. Plus, conditions – the weekly in particular – are in overbought territory.
In the meantime, as per the EIA, US crude production in the week to March 8th fell 100,000 barrels per day week-over-week to 13.1 million b/d; until two weeks ago, output was at a record 13.3 mb/d. Crude imports decreased 1.7 mb/d to 5.5 mb/d. As did stocks of crude and gasoline, which respectively dropped 1.5 million barrels and 5.7 million barrels to 447 million barrels and 234.1 million barrels. Inventory of distillates, however, increased 888,000 barrels to 117.9 million barrels. Refinery utilization increased 1.9 percentage points to 86.8 percent.
E-mini S&P 500: Currently net short 239.8k, up 35.4k.
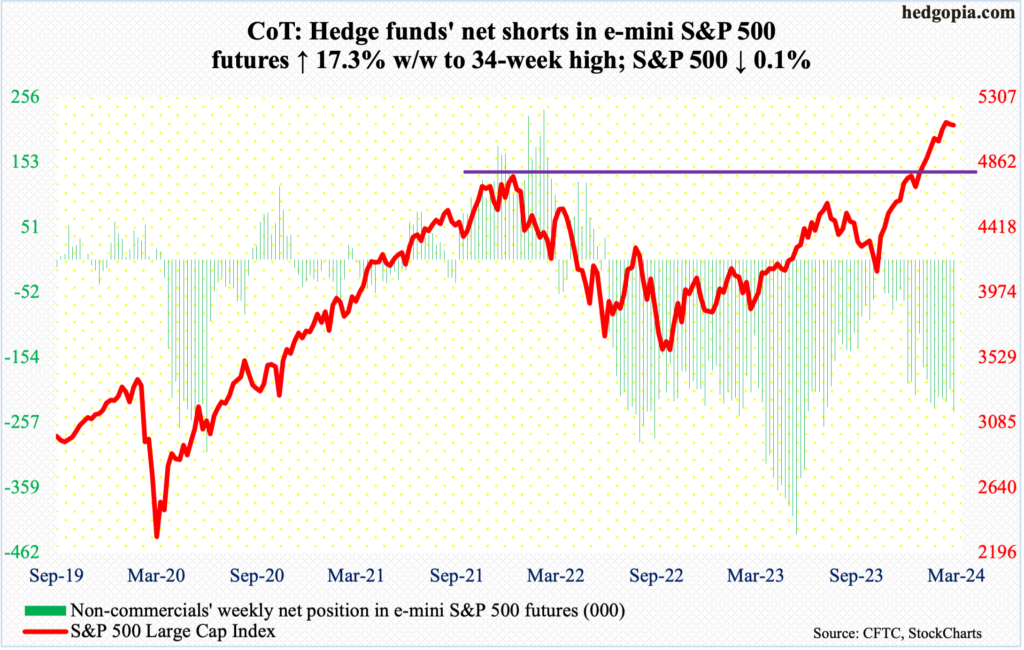
Equity bears further widened a slight opening they were granted last week, when a weekly spinning top formed on the S&P 500; this was after 16 up weeks in 18. Until Tuesday this week, it did not look like they would be able to make much of it, with the large cap index ticking 5180 intraday, which was less than nine points from the March 8th all-time high of 5189. Then, the bulls began to struggle, unable to take out high-5170s Tuesday through Thursday. Friday, the 10-day was lost. For the week, the index edged lower 0.1 percent, having reversed from up 1.1 percent at Tuesday’s high.
For the second week in a row, the weekly has now produced a candle with a long upper shadow. This is taking place even as investor sentiment further rose into giddy territory (more on this here).
The upside momentum is yet to decisively break, but this is as good an opportunity as any for the bears.
Amidst this, non-commercials raised their net shorts to a 34-week high.
Euro: Currently net long 74.4k, up 8.1k.
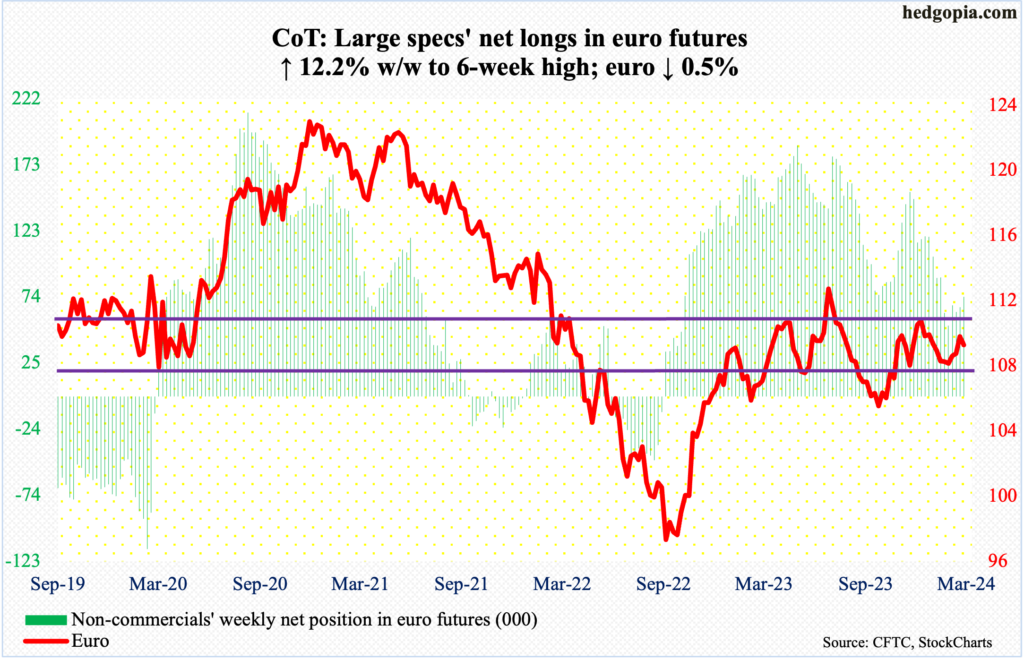
Last Friday, the euro tagged $1.0981 intraday before reversing to end the session/week at $1.0939. There is decent horizontal resistance at $1.10 and it is holding.
This week’s high of $1.0964 was reached on Wednesday, with the week ending down 0.5 percent to $1.0889 – first down week in four. On February 13th, the currency put in a low of $1.0701.
For now, the path of least resistance is toward at least the 50- and 200-day ($1.0852 and $1.0831 respectively).
Gold: Currently net long 201.6k, up 10.3k.
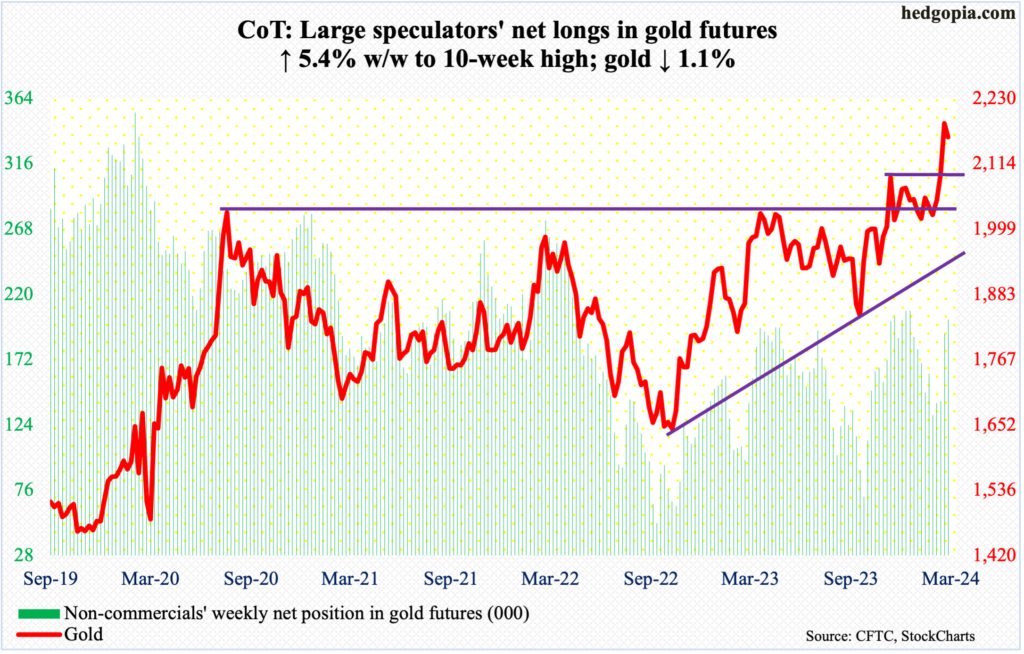
Since it hit $2,203/ounce – a record – last Friday, gold has come under slight pressure, closing this week down 1.1 percent to $2,162 – first down week in four. Gold bugs, however, showed up for most of this week at/near $2,150s. Last December, the metal ticked $2,152, which was a new high back then, and reversed lower. Before that in October, it bottomed at $1,824. It has come a long way from that low.
In the sessions ahead, gold is likely to breach the $2,150s support. In an ideal scenario for the bulls, it then heads toward $2,080s for a successful breakout retest, laying the foundation for the next leg higher.
Since August 2020, when $2,080s was hit the first time, rally attempts stopped at that level several more times, including March 2022 ($2,079), May last year ($2,085) and a few more times this year.
Nasdaq (mini): Currently net long 1.4k, up 760.
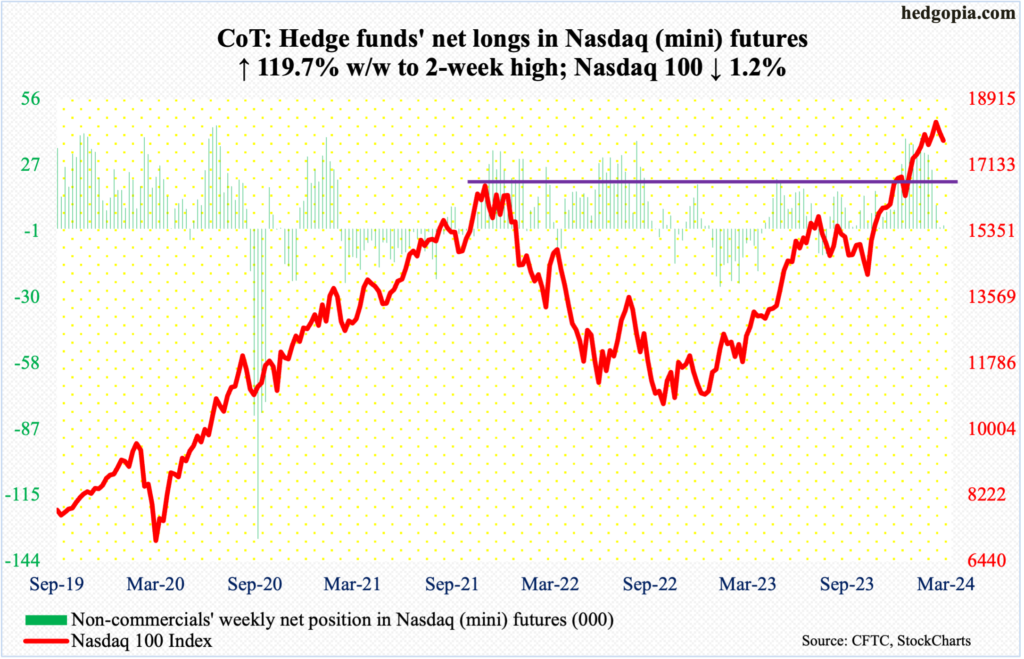
The Nasdaq 100 acts like it is exhausted and wants lower prints (more on this here). This week, it gave back 1.2 percent to 17808. This follows last week’s loss of 1.6 percent, which came in a week in which the tech-heavy index posted a new intraday high of 18415 on Friday but only to then reverse to close at 18018.
This week, the index closed under 18000, where it struggled for three weeks before breaking out last week. It turns out the breakout was false.
At 17554 lies the 50-day, coinciding with the daily lower Bollinger band at 17538. This is a must-save for the bulls.
Russell 2000 mini-index: Currently net short 19.1k, down 3.7k.
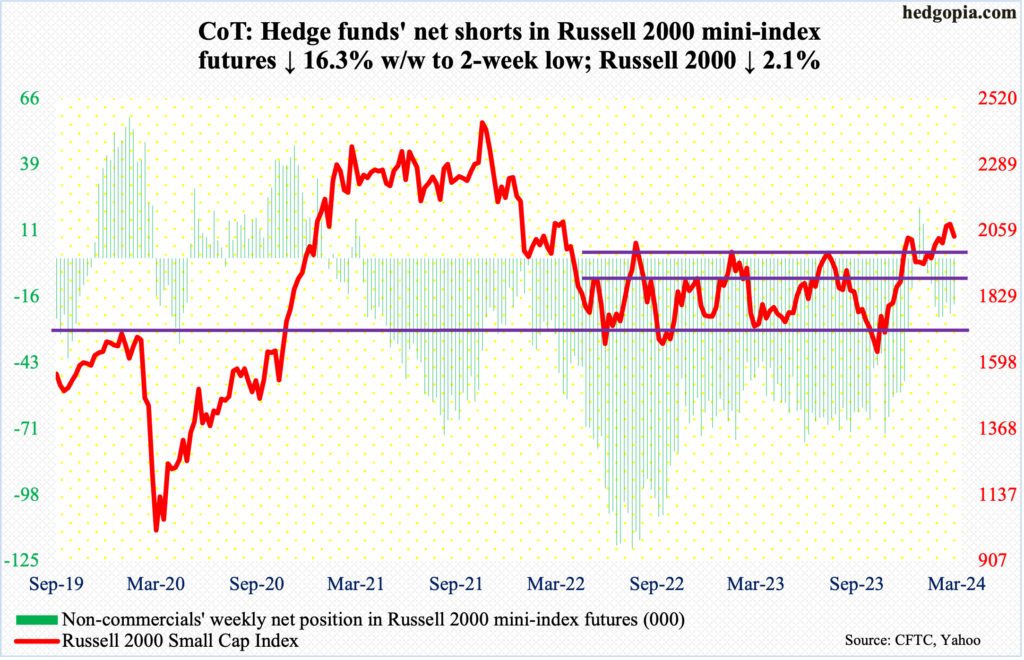
Small-cap bulls’ mettle is being tested. Last Friday’s session high of 2116 set a two-year high, which also completed a measured-move target of a 1700-1900 range breakout on December 13th. The tape has weakened since.
This week, the Russell 2000 declined 2.1 percent to 2039. But before that on both Thursday and Friday, horizontal support at 2000 drew bids, with the small cap index touching 2017 and 2019 respectively. A likely breach of this support opens the door toward a breakout retest at 1900.
US Dollar Index: Currently net long 6.2k, up 3.1k.
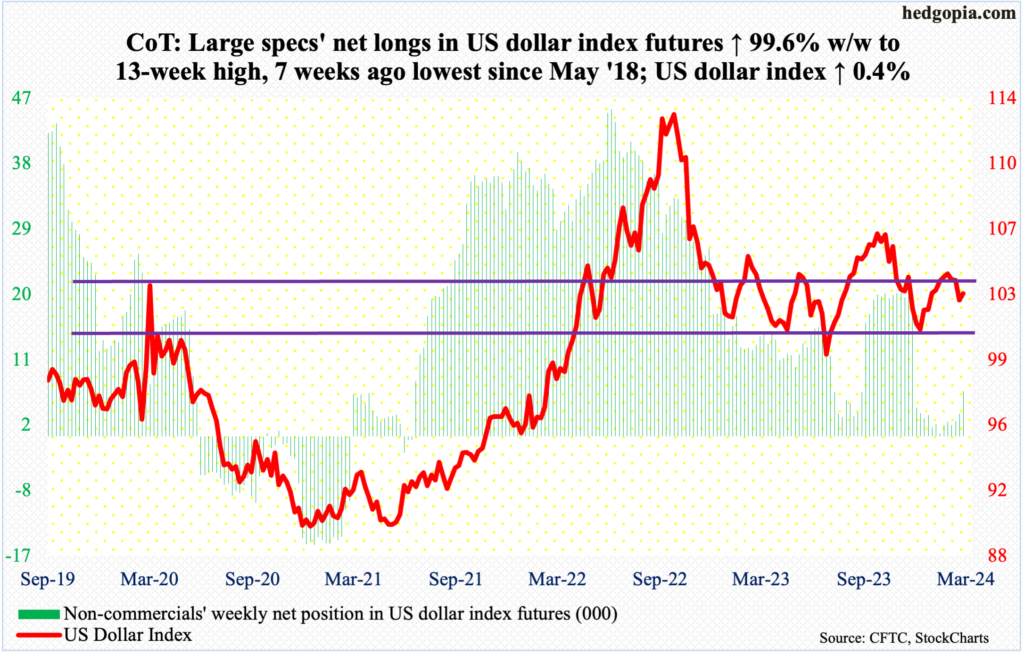
Dollar bulls are in a mood to once again go after 103-104, which goes back to December 2016. This week, the US Dollar Index rallied 0.4 percent to 103.06, tagging 103.31 on Tuesday.
Earlier, it hit 104.88 on February 14th and retreated, bottoming at 102.30 last Friday.
Immediately ahead, the 50- and 200-day at 103.41 and 103.52 respectively can act as a magnet.
VIX: Currently net short 49.1k, up 3.2k.
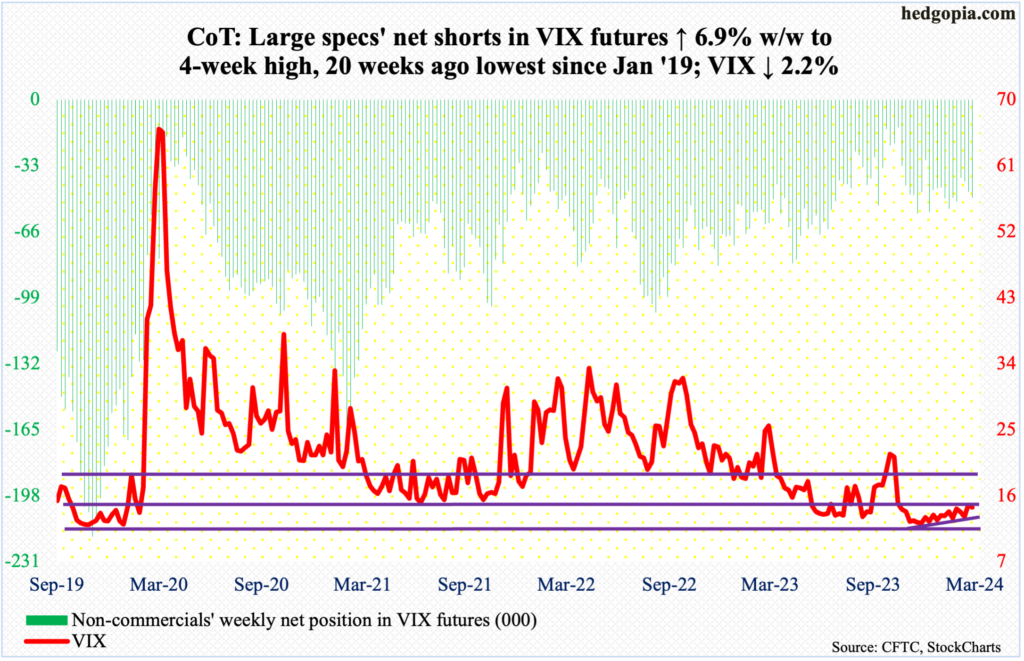
Yet again, a rising trend line from December 12th when VIX bottomed at 11.81 was touched and left intact. The volatility index tagged 13.42 Thursday, piercing through the 50-day (13.79) intraday but was saved on time, ending the session at 14.40.
Come Friday, the 200-day (14.71) was reclaimed intraday but was pushed under by close, ending the week at 14.41, down 0.33 points for the week. It was one of those rare weeks when both VIX and the S&P 500 went hand in hand.
So, VIX is trapped between the 50- and 200-day, with the former rising and the latter flattish. In the current setup, it is only a matter of time before the 50-day approaches the 200-day from underneath.
Thanks for reading!
