
Following futures positions of non-commercials are as of April 28, 2026.
10-year note: Currently net short 839.2k, up 48.2k.
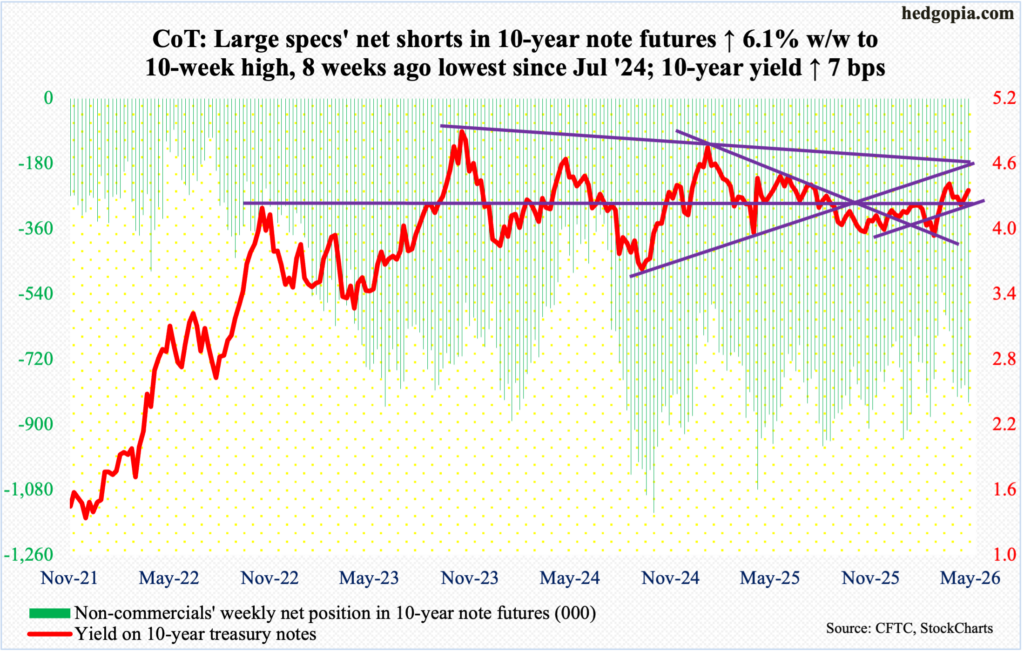
It increasingly looks like Federal Reserve Chair Jerome Powell’s successor, Kevin Warsh, will have his hands full once he takes over. Powell’s term ends on May 15 but made clear this week that he would stay on as governor for an indefinite period while an investigation over Fed headquarters renovation costs continues.
The rate-setting body FOMC (Federal Open Market Committee) is made up of 12 voting members – seven members of the Board of Governors, the president of the New York Fed and presidents of four other regional banks serving one-year rotating terms. Of the seven-member Board, President Donald Trump appointed Christopher Waller, Michelle Bowman and Stephen Miran, who will leave as Warsh is confirmed as chair. If Powell left as governor, Trump would have an opportunity to appoint one more governor.
This week, as expected, the FOMC left the fed funds rate unchanged at a range of 350 basis points to 375 basis points. What really caught people’s attention was the fact that there were four dissents, which has not happened since October 1992. Miran wanted a 25-basis-point cut, which he has consistently done since last September when he joined. The other three dissenters – Neel Kashkari (Minneapolis Fed), Beth Hammack (Cleveland Fed) and Lorie Logan (Dallas Fed) – agreed with the decision to keep the rates steady but dissented over the inclusion of an easing bias in the FOMC statement.
Trump wants lower rates, and he says so. It is too soon to say if Warsh as Fed chair would acquiesce, as early indications are that he might lean on the hawkish side. But if he were to lean dovish, he would have to convince these regional bank presidents that inflation, which has persistently remained well north of the Fed’s target of two percent, would not be a problem given the new energy dynamics due to the current Iran war.
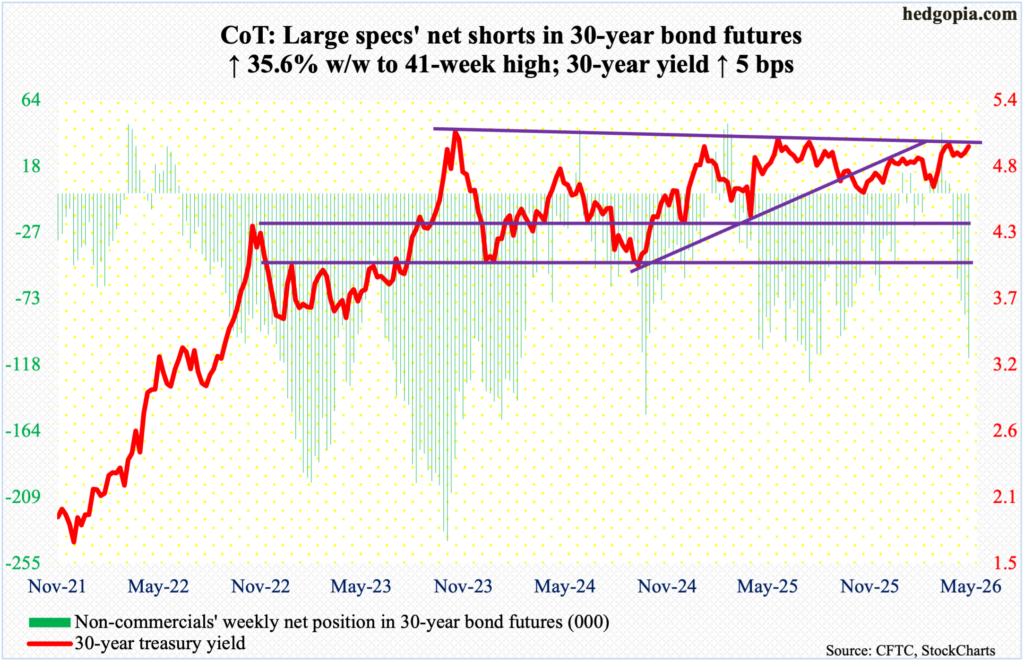
30-year bond: Currently net short 113.7k, up 29.9k.
Major US economic releases for next week are as follows.
Factory orders (March) will be published on Monday. March orders for non-defense capital goods ex-aircraft – proxy for business capex plans – jumped 3.3 percent month over month to a seasonally adjusted annual rate of $82.9 billion, which set a fresh high.
Job openings (JOLTs, March), new home sales (February and March) and the ISM services index (April) are on deck for Tuesday.
In February, non-farm job openings dropped 358,000 m/m to 6.88 million. Last December’s 6.55 million was the lowest since September 2020, with an all-time high of 12.3 million recorded in March 2022.
Sales of new homes tumbled 17.6 percent m/m in January to 587,000 units (SAAR) – a 39-month low. Last November, sales hit a 45-month high 764,000.
March non-manufacturing activity shrank 2.1 points m/m to 54. With this, the economy has been in expansion mode for the 70th straight month.
Labor productivity (1Q26) is due out Thursday. In the December quarter, non-farm output per hour rose at an annualized rate of 2.5 percent – a five-quarter high.
Friday brings payrolls (April) and University of Michigan’s consumer sentiment index (May, preliminary).
In March, the economy created 178,000 non-farm jobs, for a monthly average in the first three months this year of 68,000, which represents quite an improvement from a monthly average last year of 10,000.
Consumer sentiment dropped 3.5 points m/m in April to 49.8 – a new low. The prior low of 50 was set in June 2022, followed by last November’s 51.
WTI crude oil: Currently net long 152.2k, up 852.
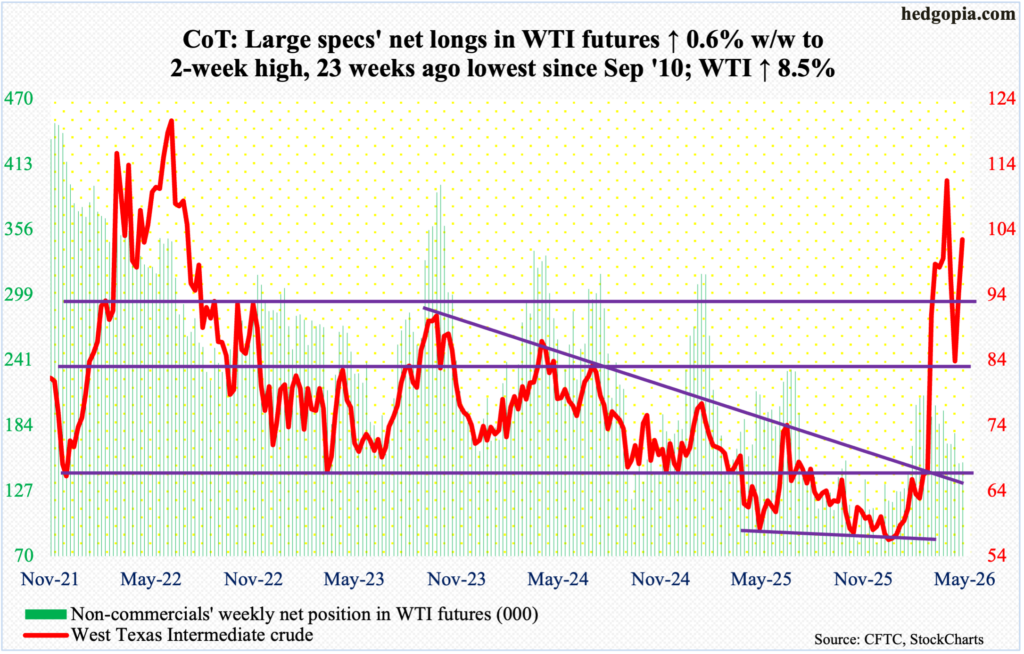
Three weeks ago, after having peaked intraday at $119.48 on March 9 and thereafter at $117.63 on April 7, West Texas Intermediate crude bottomed just north of $80 at $80.56. Since that low, it has now rallied for two consecutive weeks, with gains of 8.5 percent this week to $102.46/barrel. Oil bulls nevertheless were unable to hang on to Thursday’s intraday high $110.93. this represents a second lower low since the March high, which set a four-year high.
April, by the way, formed a very wide monthly spinning top. WTI has experienced massive strength in recent weeks. On February 27 – a day before Israel and the US attacked Iran – the crude tagged $64.85 intraday before exploding higher in the subsequent sessions. Even earlier, early this year, bulls defended horizontal support at $56.
But longs’ willingness to sell rallies short of the March high probably suggests they do not believe the crude has staying power to sustainably stay north of $100. If so, horizontal support at $91-$92 is crucial.
In the meantime, as per the EIA, US crude production in the week to April 24 increased 1,000 barrels per day week over week to 13.586 million b/d; output registered a record 13.862 mb/d in the week to November 7 last year. Crude imports decreased 328,000 b/d to 5.8 mb/d. As did stocks of crude, gasoline, and distillates, which respectively declined 6.2 million barrels, 6.1 million barrels and 4.5 million barrels to 459.5 million barrels, 222.3 million barrels and 103.6 million barrels. Refinery utilization rose five-tenths of a percentage point to 89.6 percent.
E-mini S&P 500: Currently net short 101.4k, down 8.7k.
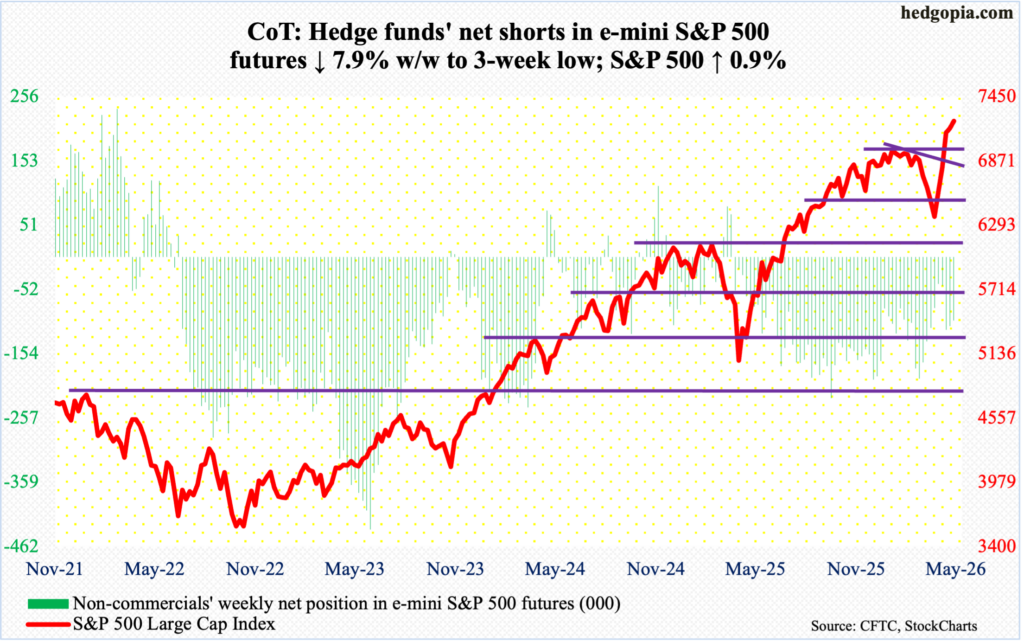
Other than Friday’s shooting star, equity bulls cannot complain much how the week evolved. Short-term horizontal support/resistance was in play both ways before the level was definitively reclaimed on Thursday; more gains followed on Friday with a fresh intraday high of 7273, although bulls gave much of it away, with the S&P 500 ending the week at 7230, up 0.9 percent. This was the fifth consecutive up week.
The large cap index bottomed at 6317 on March 30, rallying 15 percent through Friday’s high. Prior to this, it declined 9.8 percent from 7002, which was a prior peak reached on January 29. That high was taken care of three weeks ago. Before a retest at 7000 occurs, bulls now have carved up other support levels where they can show up.
If Friday’s potentially bearish shooting star is confirmed early next week, then 7140s is where buying interest can appear. After that lies 7050s, or breakout retest just north of 7000.
Euro: Currently net long 35.7k, down 5.6k.
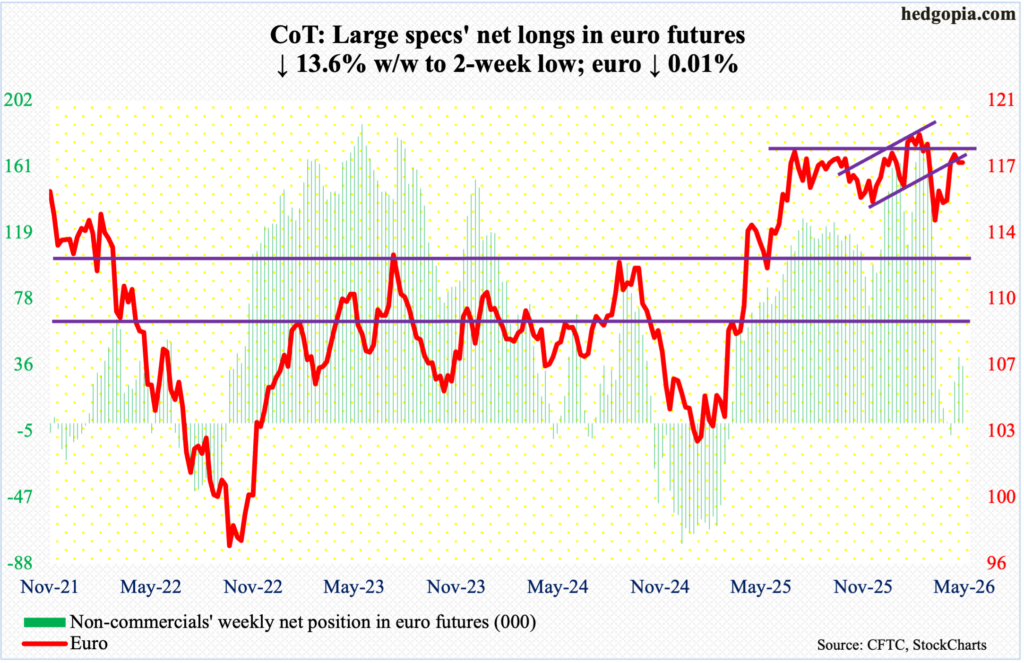
For the second consecutive week, the euro finished the week with a weekly spinning top. This week, it ended flat at $1.172, with Friday’s high $1.179 not kept.
On April 17, the euro was rejected after tagging $1.185. For a year now, it has played ping pong between $1.14 and $1.18, with a four-and-a-half-year high $1.208 posted on January 27. On March 13, it bottomed at $1.141. In January last year, the currency bottomed at $1.018.
Bulls’ repeated failure at $1.18s raises the odds that the currency at some point is likely to gravitate toward the bottom of the established multi-year range. This likely accelerates once the 50- and 200-day ($1.165 and $1.168 respectively) are compromised.
Gold: Currently net long 159.6k, down 4.4k.
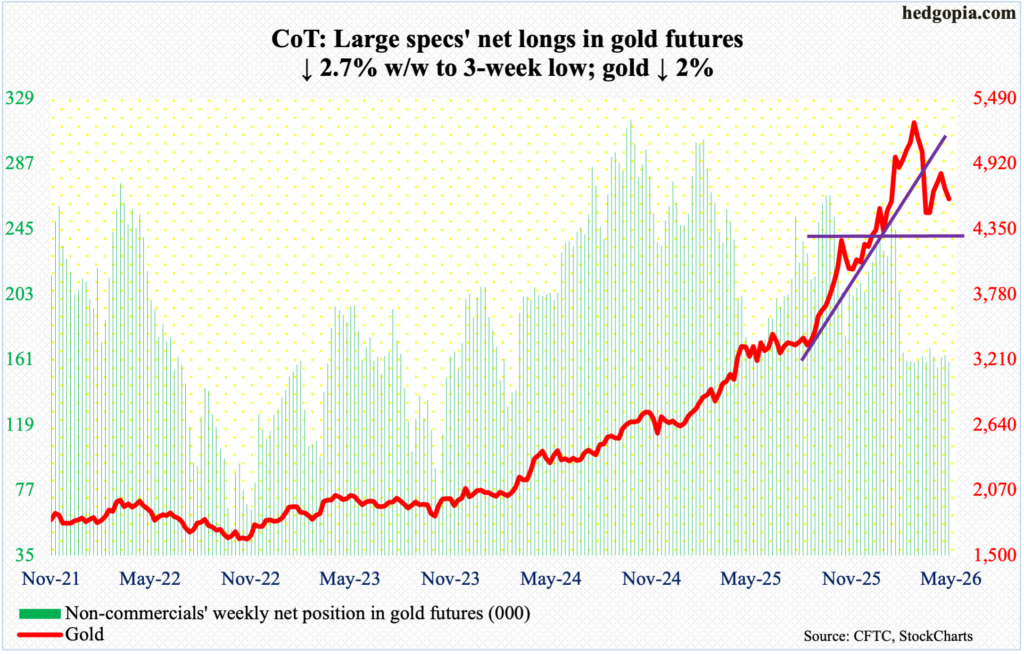
After rallying for four consecutive weeks, gold closed lower back-to-back, with a decline of two percent this week to $4,613/ounce.
Earlier on March 23, gold bottomed at $4,099 intraday to find support just above the 200-day (now $4,259); this essentially was a test of horizontal support at $4,370s. The metal’s all-time high was registered on January 29 at $5,608. Gold has made lower highs since, including an intraday high of $4,892 on April 27 to get rejected at the 50-day (now $4,835). Gold has remained trapped between the averages since March 18. Before the 200-day, there is important straight-line support at $4,540s, followed by $4,370s.
Nasdaq (mini): Currently net short 2.3k, up 11.8k.
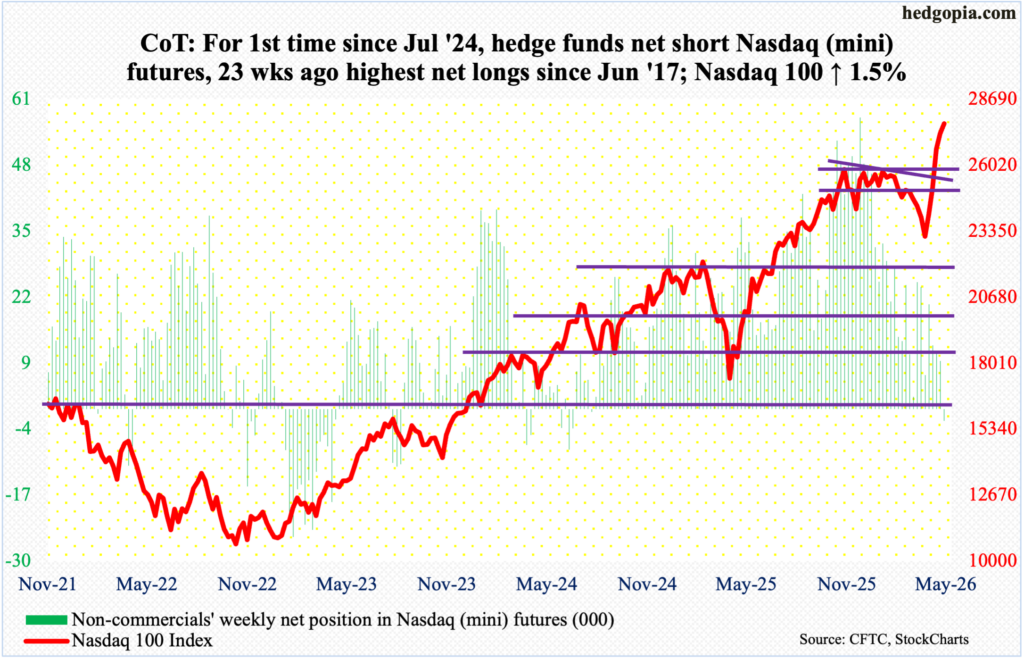
In a week in which five of the Magnificent Seven – Apple (AAPL), Google parent Alphabet (GOOG), Amazon (AMZN), Facebook parent Meta (META) and Microsoft (MSFT) – reported, the Nasdaq 100 jumped 1.5 percent this week to 27710, with a fresh intraday high of 27787 on Friday. Through that high, the tech-heavy index is up 21.7 percent from March 30 when it bottomed at 22,841.
Earlier, the index began to unravel on January 28 facing rejection 17 points short of the October 29 high of 26182. Those highs, which the bears were hoping would be tantamount to a double top, should now act as support. In the week before, a breakout retest at 26100s nearly occurred, with a couple of sessions drawing bids just north of 26400.
Right here and now, there is decent lateral support at 27000.
Russell 2000 mini-index: Currently net short 17.1k, up 1.2k.
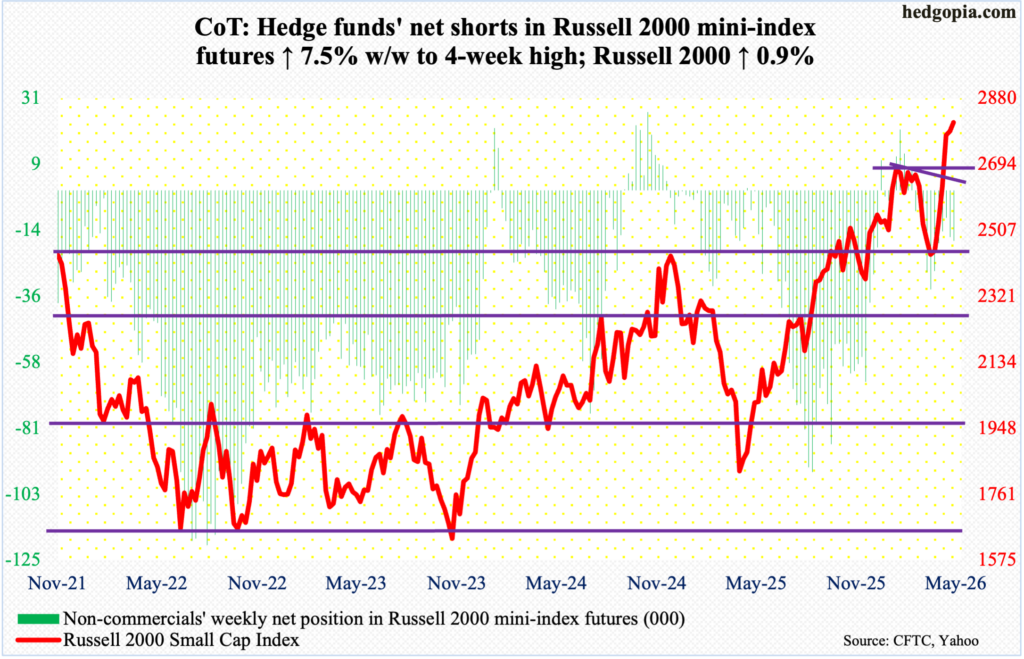
The Russell 2000 notched a fresh closing high of 2813, up 0.9 percent for the week, but also for the second week in a row ended with a potentially bearish weekly candle. In the wake of last week’s spinning top, this week formed a hanging man. They need confirmation.
Small-cap bulls deserve kudos for the fact that they engineered a successful breakout retest at 2730s several times this week. On January 27, the Russell 2000 peaked at 2735, before posting a series of lower highs. This trendline resistance was taken care of a couple of weeks ago, coming on the heels of a breakout at 2540s in the week before.
Longs deserve the benefit of the doubt so long as 2730s remain intact, but this task likely gets harder in the sessions/weeks to come. This week’s high of 2816 failed to surpass last week’s 2818, even as the weekly is beginning to flash signs of fatigue. On March 30, the Russell 2000 bottomed at 2405.
US Dollar Index: Currently net long 4.5k, down 475.
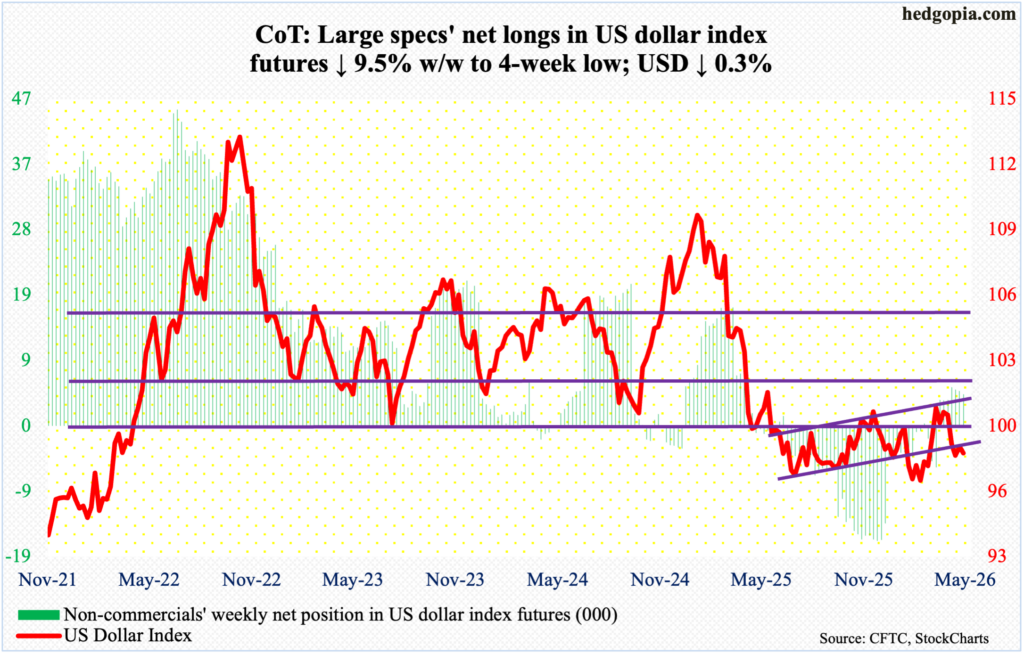
Trapped between the 50- and 200-day, which are not that far apart at 98.98 and 98.56 respectively, the US dollar index sliced through the latter on Thursday as it was repeatedly denied at the former for several sessions. For the week, it gave back 0.3 percent to 98.21. This was a fourth down week in five.
Earlier, after unsuccessfully trying for five weeks to reclaim 100, including March 30 when an intraday high of 100.64 was hit intraday, dollar bulls gave up four weeks ago. Resistance just north of 100 goes back more than a decade, and the level was lost last April.
In January last year, after a three-plus-month rally, the US dollar index reversed hard at 110.18, subsequently reaching 96.38 in June and successfully testing that low with a lower low 96.22 in September. On 27 January this year, another lower low 95.55 was ticked, and that drew bids. The positive momentum resulting out of that low hit the wall at 100. Dollar bears will be eyeing mid-90s again once they succeed in reclaiming 97.70s.
VIX: Currently net short 27.8k, up 580.
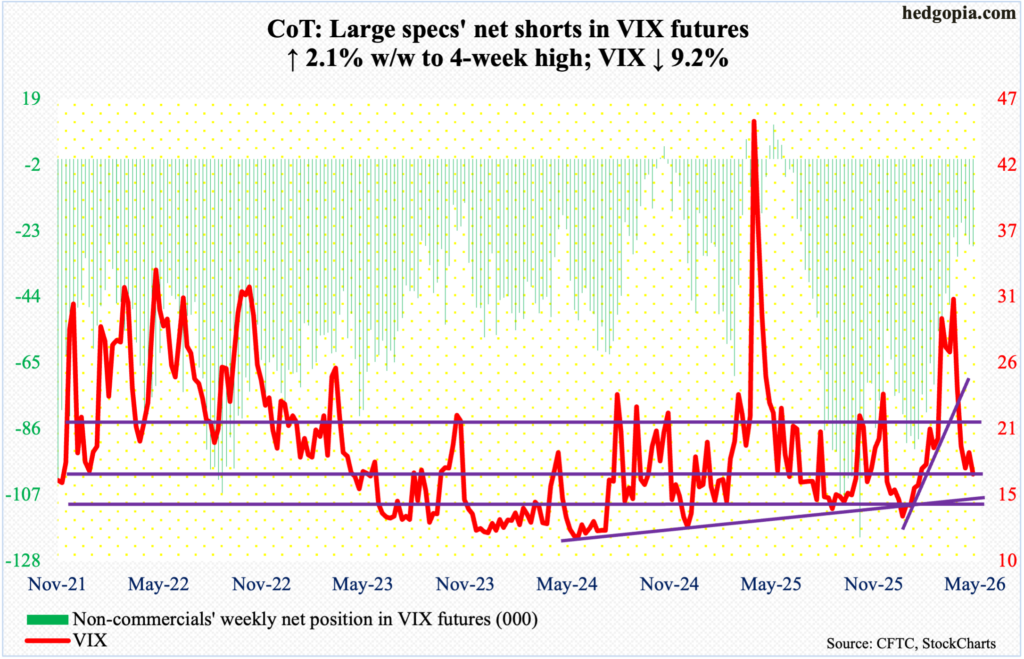
Volatility bulls could no longer save the 200-day (18.27), losing 1.72 points for the week to 16.99. This was a fourth down week in five. Earlier on March 9, VIX experienced a spike reversal at 35.30. In the subsequent sessions, the 50-day (22.24) was breached.
The persistent drop in the volatility index the past couple of months comes at a time when heightened investor complacency is beginning to register elsewhere in the options market. The CBOE equity-only put-to-call ratio has produced readings of 0.50s or lower, eight of them in the 0.40s, for 18 consecutive sessions. The 21-day average of the ratio came in at 0.523 on Friday, which was the lowest print since mid-October last year.
Thanks for reading!
