
Following futures positions of non-commercials are as of April 3, 2018.
10-year note: Currently net short 375.4k, up 70.2k.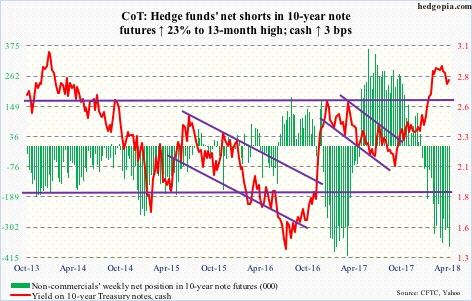
Ten-year Treasury yields (2.78 percent) rose from 2.03 percent last September to 2.94 percent this February. The 30-year fixed mortgage rate correspondingly rose from 3.78 percent to 4.46 percent.
Despite this backup in yields, the 10-year rate remains bound by a three-decade-old descending channel, although it has been hammering on the upper bound. What if a convincing breakout occurs? What would that do to the mortgage rate?
One of the things arguably working against a sustained rise in 10-year yields is the amount of leverage in the system – government, corporate or household. Rising interest payments do not help.
Housing – as important a sector as it is – is another potential victim.
Sales of both existing and new homes – the former in particular – are showing signs of plateauing. Already, the median price of a home has galloped ahead of personal income that is only sauntering. At a time like this, a sustained rise in the mortgage rate can only hurt housing/economy. This in and of itself in due course should help put downward pressure on rates.
30-year bond: Currently net long 9.7k, down 35.1k.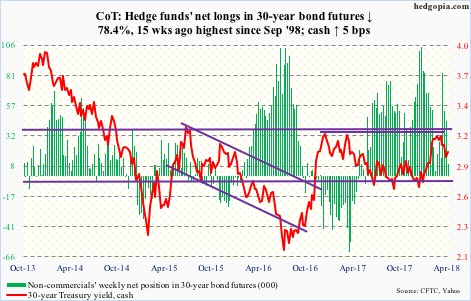
Major economic releases next week are as follows.
The NFIB small business optimism index and PPI-FD – both for March – will be reported Tuesday.
Small-business optimism increased 0.7 points month-over-month to 107.6 in February. This was the 15th consecutive month of reading north of 100 and was the second highest after 108 in 1983.
Producer prices rose 0.2 percent m/m in February and 2.8 percent year-over-year. Core PPI rose 0.4 percent m/m and 2.7 percent in the 12 months to February.
Wednesday brings CPI (March) and FOMC minutes for the March 20-21 meeting.
Consumer prices inched up 0.2 percent m/m in February. In the 12 months through February, they rose 2.2 percent. Core CPI during that period rose 0.2 percent and 1.9 percent, respectively. Core CPI has grown sub-two percent y/y since April last year.
The fed funds rate went up 25 basis points in the March meeting to a range of 150 and 175 basis points. The FOMC’s dot plot expects two more hikes in the remaining six scheduled meetings this year. With wage growth still subdued and non-farm payroll growth averaging 202,000 in the first three months, odds of three hikes are fading.
University of Michigan’s consumer sentiment index (April, preliminary) and JOLTS (February) are due out Friday.
Consumer sentiment rose 1.7 points m/m to 101.4 in March. This was the highest since 103.8 in January 2004.
Non-farm job openings in January jumped 645,000 m/m to a new all-time high of 6.31 million.
Crude oil: Currently net long 734.5k, down 35.7k.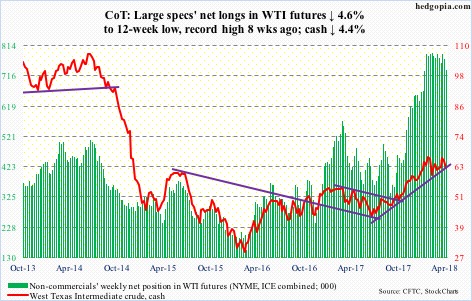
Subsequent to the failure nine sessions ago to take out the high from January 25, spot West Texas Intermediate crude ($62.06/barrel) proceeded to test the 50-day moving average this week, and lost. Friday, the crude lost 2.3 percent and was literally sitting on a rising trend line from the February 9 low. A failure here raises the likelihood that the crude tests support at $60, which in all likelihood takes place next week. This support also approximates the daily lower Bollinger band.
Non-commercials are still heavily net long. A loss of $60 on the cash can lead them to continue to cut back. In this scenario, $55 is the next support, which is where the 200-day rests.
The EIA report for the week of March 30 showed crude production continued its uptrend – up 27,000 barrels per day to 10.46 million b/d.
Distillate stocks rose too, by 537,000 barrels to 129.5 million barrels.
Crude and gasoline stocks, however, fell – down 4.6 million barrels and 1.1 million barrels to 425.3 million barrels and 238.5 million barrels, respectively.
As did crude imports, which dropped 250,000 b/d to 7.9 mb/d.
Refinery utilization inched up seven-tenths of a percentage point to 93 percent.
E-mini S&P 500: Currently net long 212.6k, down 14.2k.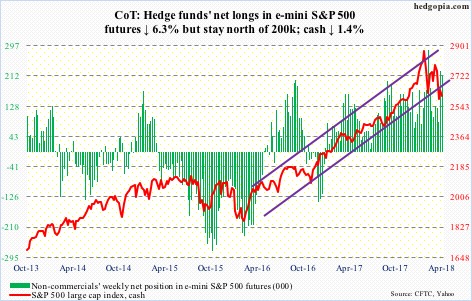
U.S.-based equity funds (including ETFs) continued to bleed, losing $11.6 billion in the week to Wednesday (courtesy of Lipper.com). In the prior two, $24 billion was withdrawn.
The redemption trend is also evident in S&P 500-focused ETF’s. In the week through Wednesday, SPY (SPDR S&P 500 ETF), VOO (Vanguard S&P 500 ETF) and IVV (iShares core S&P 500 ETF) lost a combined $7.2 billion. In the prior week, $11.3 billion was withdrawn, and $10 billion before that (courtesy of ETF.com).
Interestingly on the cash (2604.47) on Wednesday, trade dispute-induced early weakness was bought hand over first to end the session up 1.2 percent. Even in that session, money came out of these three ETF’s. And index volume was low. Friday, it dropped 2.2 percent, once again testing the 200-day. For nimble traders, this continues to present opportunities to sell out-of-the-money weekly puts or use OTM bull put spreads.
Euro: Currently net long 134.4k, down 6.7k.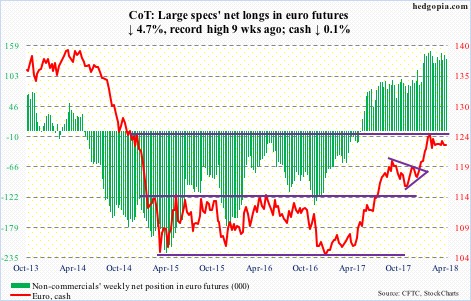
The week began with an unsuccessful test of the 50-day, which the cash ($122.93) slightly closed under last week. On the weekly chart, there is plenty of room for the euro to continue lower. On the daily, Friday it found support at the daily lower Bollinger band. This is also an area – $122.25-ish – that is part of a symmetrical triangle. A loss of this support could make the currency vulnerable to a drop to 119.
Near term, a test of the 50-day ($123.40) is possible.
Gold: Currently net long 166.6k, down 36.8k.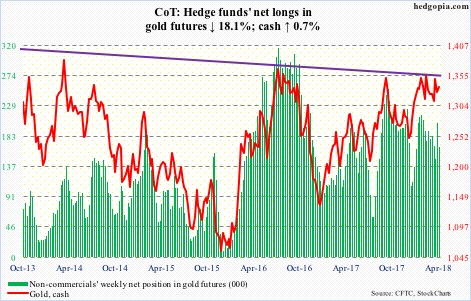
Range-bound action continues on the cash ($1,336.10/ounce) – between $1,300 and $1,360-70. Wednesday, gold rallied intraday to $1,352.50, but was not able to hang on to the gains. This was followed by a loss of the 50-day Thursday. Friday, the average was recaptured. The Wednesday high also kissed the daily upper Bollinger band. The lower band lies at $1,306.22.
Through Wednesday’s intraday high, gold was up 1.9 percent for the week. Flows helped, as in the week to Wednesday GLD (SPDR gold ETF) took in $264 million and IAU (iShares gold trust) $162 million (courtesy of ETF.com). Concurrently, non-commercials reduced holdings by 18.1 percent.
Nasdaq 100 index (mini): Currently net short 15.8k, down 33.4k.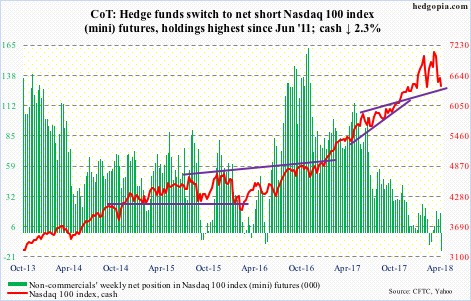
The last time the cash (6433.21) lost the 200-day was in July 2016. Monday came close, but the bears did not have enough firepower.
The bulls also traced out a higher intraday low this week versus during the February selloff. All good, except the Nasdaq 100 – as do other major US equity indices – remains under the falling 50-day (6767.46). It is a perfect setup to play the range using options.
Medium- to long-term, the technical picture has weakened. The index also suffered a false breakout mid-March. The 50-day is where the bulls and bears are likely to fight a duel, and that can dictate near-term direction.
For now, in the week to Wednesday, QQQ (PowerShares QQQ ETF) lost $493 million (courtesy of ETF.com). In the prior two, $3.3 billion was redeemed.
Russell 2000 mini-index: Currently net long 19.6k, down 7.5k.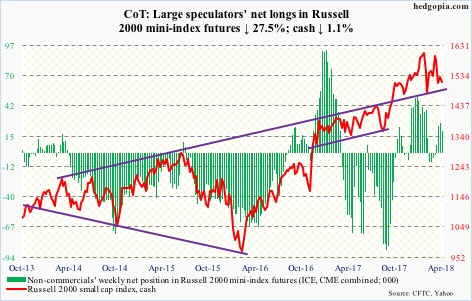
On March 13, the cash (1513.30) came within six-plus points of the all-time high of 1615.52 from January 24. At the same time, bids showed up this week before the lows of February were tested. We thus have a pattern of lower highs and higher lows. Near-term direction will be decided by whichever way this symmetrical triangle breaks.
The bulls would have raised their odds should the 50-day (1543.55)/1550 be conquered. Thursday, the average came in the way. A test of the 200-day (1490.48), which was successfully tested early this week, is possible next week.
In the week to Wednesday, IWM (iShares Russell 2000 ETF) lost $1.2 billion, while IJR (iShares core S&P small-cap ETF) pulled in $13 million (courtesy of ETF.com).
US Dollar Index: Currently net short 1.2k, down 575.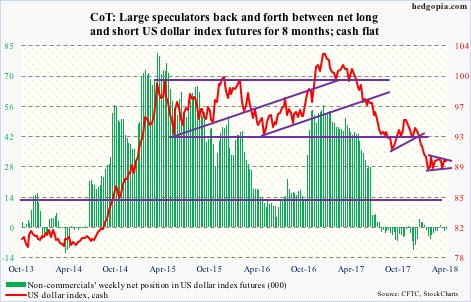
Dollar bulls probably find this week’s action on the cash (89.78) heartening, even though the cash was flat. After defending support at 88-89 last week, they defended the 50-day this week.
If the weekly chart prevails, there is room to rally. Near term, the daily likely comes in the way. Resistance at 90.50, which also approximates the daily upper Bollinger band, was just about tested Thursday and Friday – both unsuccessful. The daily chart is itching to head lower.
VIX: Currently net long 79.1k, up 4.4k.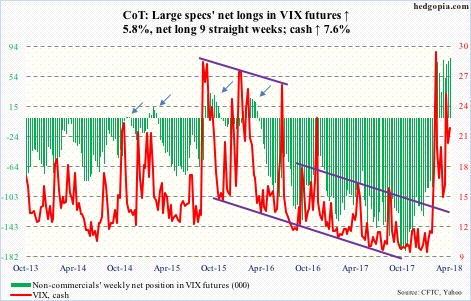
Resistance at 26 on the cash (21.49) once again repelled rally attempts this week. Volatility bulls have been unable to rally past this level for nearly two months now. From their perspective, the good thing is that, barring a brief intraday drop below 14 early March, support at 15-16 is intact.
Thanks for reading!
