
Following futures positions of non-commercials are as of April 24, 2018.
10-year note: Currently net short 462.1k, up 90.4k.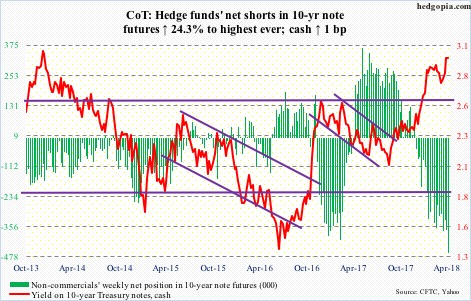
Now what?
The 10-year Treasury rate (2.96) crossed three percent this week – the first time this has happened since January 2014. Early this month, these notes yielded 2.72 percent.
Signs of fatigue are showing up, with the week ending with a shooting star. The move to 3.04 percent Wednesday was fleeting. There is room for yields to continue lower. Non-commercials are the most net short ever, and can get squeezed in the right circumstances for bond bulls.
In getting thus far, the 10-year managed to forge decent support at 2.94 percent. This materialized after yields broke this January out of resistance at 2.62 percent – now support. This likely gets tested.
While all this was going on, Tuesday saw Caterpillar (CAT) management saying first-quarter earnings “will be the high-water mark for the year.” They are essentially saying this is as good as it gets.
In 1Q18, the US economy grew 2.3 percent. This preceded real GDP growth of 2.9 percent in 4Q17, and 3.2 percent and 3.1 percent before that. The ISM manufacturing index in March fell 1.5 points month-over-month, but February’s 60.8 was the highest since 61.4 in May 2004. These are very good numbers, and do tend to revert back to the mean.
In this environment, lots of shops probably view the recent backup in yields as an opportunity to go long bonds.
30-year bond: Currently net long 18.3k, down 27k.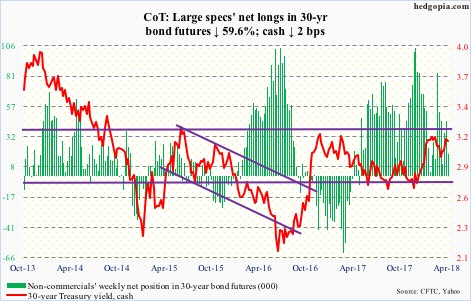
Major economic releases next week are as follows.
Personal income and outlays for March is scheduled for Monday. Core PCE (personal consumption expenditures) rose 1.6 percent in the 12 months to February. This is the Fed’s favorite measure of consumer inflation. The last time it rose with a two handle was in April 2012.
FOMC meeting begins Tuesday and ends the next. This is the year’s third meeting, and five more remain after this. In the March 20-21 meeting, the fed funds rate was raised by 25 basis points to a range of 150 to 175 basis points. The dot plot expects two more hikes this year. Next week’s meeting is not one of them, as markets expect the Fed to stand pat.
Also Tuesday, April’s ISM manufacturing index comes out.
Productivity (1Q18, preliminary), durable goods (March, revised) and the ISM non-manufacturing index (April) are on tap for Thursday.
Non-farm output per hour increased 1.1 percent y/y in 4Q17. This was the slowest pace in four quarters. The last time productivity grew with a two handle was in 3Q10.
Preliminarily, March orders for non-defense capital goods ex-aircraft – proxy for business capex plans – rose seven percent y/y to a seasonally adjusted annual rate of $67.2 billion. Orders peaked at $70.3 billion in September 2014.
Services activity in March inched down seven-tenths of a point m/m to 58.8. January’s 59.9 was the highest ever (data only goes back to January 2008).
Friday brings employment numbers for April. March produced 103,000 non-farm jobs, for an average of 202,000 in the first three months this year.
Crude oil: Currently net long 759k, down 10k.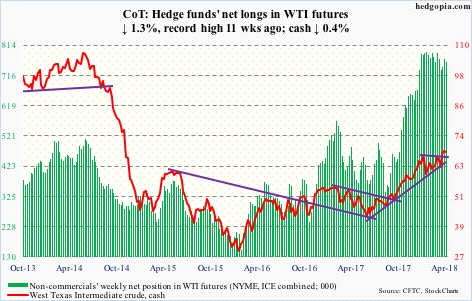
Spot West Texas Intermediate crude ($68.10/barrel) continues to digest its recent gains. Resistance around last week’s high of $69.55 goes back to September 2005. Near term, odds of breakout retest at $66.50-ish are rising. The week produced a long-legged doji.
The EIA report for the week of April 20 showed that crude stocks, production and imports all rose – respectively up 2.2 million barrels to 429.7 million barrels, up 46,000 barrels/day to 10.59 million b/d, and up 539,000 b/d to 8.47 mb/d.
Gasoline stocks increased as well, up 840,000 barrels to 236.8 million barrels. Distillate stocks, however, fell 2.6 million barrels to 122.7 million barrels.
Refinery utilization dropped 1.6 percentage points to 90.8 percent.
E-mini S&P 500: Currently net long 211k, down 1.3k.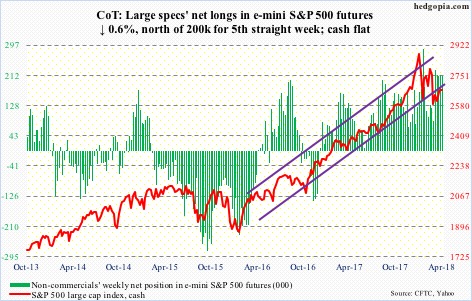
The 200-day was tested on Wednesday – again successfully. There was a similar test on February 9. This was followed late March-early April during which the cash (2669.91) lingered around the average for 10 sessions before rallying.
In the end, it proved to be a great week to play the range.
In general, the more times a level is tested, the higher the odds it gives way sooner or later. For now, the bulls can breathe a sigh of relief. Last week, rally attempts were rejected at a falling trend line from January 26 when the S&P 500 peaked at 2872.87. The same resistance will be tested around 2700.
Of late, flows have been positive, but nothing comparable to what was lost previously.
In the week to Wednesday, US-based equity funds (including ETFs) took in $3.5 billion. This makes a three-week total of $13.8 billion (courtesy of Lipper.com). This was preceded by outflows of $35.6 billion over three weeks.
In the same week, SPY (SPDR S&P 500 ETF) gained $196 million, VOO (Vanguard S&P 500 ETF) 74 million and IVV (iShares core S&P 500 ETF) $1.8 billion (courtesy of ETF.com).
Euro: Currently net long 130.6k, down 20.9k.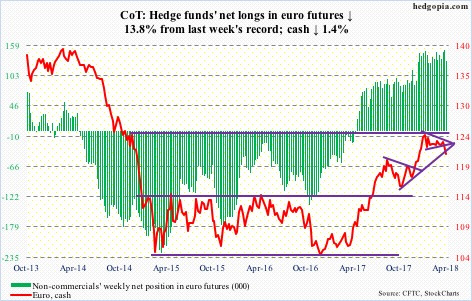
There goes that support.
The cash ($121.36) peaked at $125.37 on January 25. A falling trend line from the all-time high of $160.20 in April 2008 lied around there. Since then, the euro has been making lower highs, even as buyers persistently showed up at $122-122.50 support, which cracked this week.
The risk facing the bulls is non-commercials’ massive net longs. The loss of this support adds pressure on them to lock in profit.
Near-term, though, the currency can go test the broken support.
Gold: Currently net long 136.6k, down 26.4k.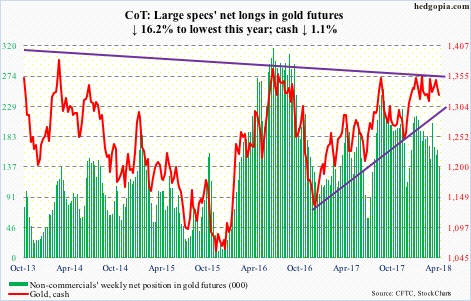
One more week in which flows were positive but gold bugs were not able to put that to good use.
In the week through Wednesday, GLD (SPDR gold ETF) attracted $226 million and IAU (iShares gold trust) $122 million (courtesy of ETF.com). In the past six, inflows totaled $1.6 billion and $940 million, in that order.
The cash ($1,323.40/ounce) opened the week with a loss of the 50-day, and continued lower, along with the now-dropping daily lower Bollinger band.
Gold has been range-bound between $1,360-70 on the up and $1,300 on the down for a while now. This time around, the lower bound has additional support. The 200-day ($1,303.32) lies there, as does a rising trend line from December 2016.
The metal dropped to $1,315.80 intraday Friday before bids showed up.
Nasdaq 100 index (mini): Currently net short 24.7k, up 16.8k.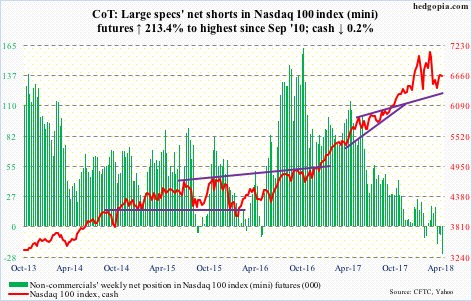
Another higher low on the cash (6656.35) this week. At one point Wednesday, the Nasdaq 100 was down 3.6 percent for the week. Kudos to the bulls for erasing just about all of that.
For continued traction, they have to jump over the hurdle of broken technicals, including a false breakout accompanied by an island reversal in March. The 50-day already provided resistance Friday.
At least in the week ended Wednesday, flows were not cooperating, with QQQ (PowerShares QQQ ETF) losing $1.9 billion (courtesy of ETF.com).
Russell 2000 mini-index: Currently net long 20.3k, up 4.5k.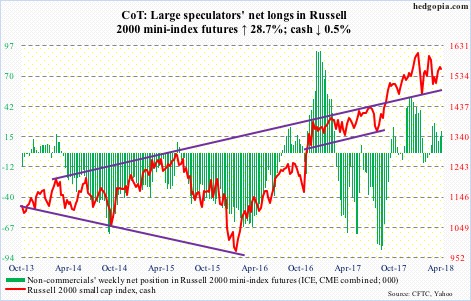
The 50-day was defended this week. The cash (1556.24) continues to trade within a three-month symmetrical triangle, the upper end of which came in the way last week. That trend line now extends to 1580s. This is the best-case scenario. Should it come to pass, shorts in all likelihood would be all over the Russell 2000. Small-caps act better versus large-caps, but are stuck in a rut nevertheless.
In the week to Wednesday, $1 billion moved out of IWM (iShares Russell 2000 ETF), while IJR (iShares core S&P small-cap ETF) took in $127 million (courtesy of ETF.com).
US Dollar Index: Currently net short 1.8k, down 634.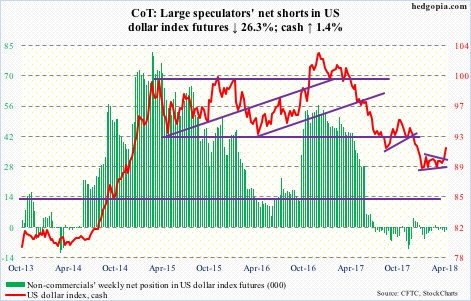
The euro, which dropped 1.4 percent this week, makes up 57.6 percent of the US dollar index. This likely contributed to the latter’s 1.4-percent rally this week.
Importantly, the cash (91.34) broke out of a symmetrical triangle. Technicians are now probably eyeing 92.50. For that to happen, dollar bulls will first have to win over the 200-day, which the dollar index came within 0.15 of testing before reversing with a gravestone doji Friday.
Down below, there is now another layer of support, at 90.30-ish. This week’s action preceded persisted defense of support at 88-89, which goes back to at least 2004.
Near term, odds favor breakout retest.
VIX: Currently net long 31.6k, down 46.3k.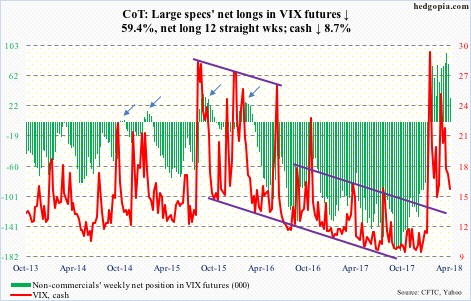
It was one of those weeks in which both volatility bulls and bears could claim victory. Sort of. Support at 15-16 was once again tested, and held. At the same time, the 50-day held firm.
Some daily momentum indicators have turned lower from the median. In the very near term, this is an opportunity for the bears to push the cash (15.41) lower. The daily lower Bollinger band lies at 13.59, which is about where the 200-day rests.
Thanks for reading!
