
Following futures positions of non-commercials are as of June 19, 2018.
10-year note: Currently net short 359.5k, up 23.5k.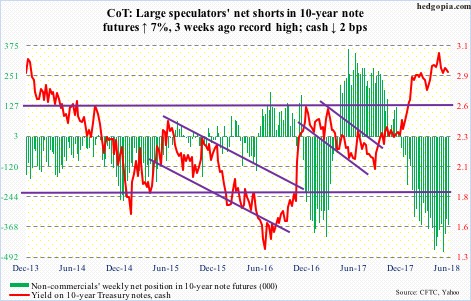
Volatility remains suppressed – pretty much across the investing landscape. In US equities, both small-caps and tech – considered risk-on – are attracting bids. Gold continues to languish. The Japanese yen – another save-haven – acts a little better, but nothing to write home about. All this amidst the ongoing tariff tit for tat between the US and China. At this point in time, markets are not too worried about this evolving into another Smoot-Hawley.
Here is the thing.
China is the largest holder of Treasury securities. In April, its holdings fell $5.8 billion month-over-month to $1.18 trillion. Japan is second at $1.03 trillion. China’s peaked at $1.32 trillion in November 2013, and has since trended sideways to slightly down. Being the largest holder of these securities, it is in a position to wield some power. Particularly so as US budget deficit is probably headed higher.
The 12-month running total of US deficit bottomed at $403.6 billion in January 2016, with April this year at $706.8 billion. The Tax Cuts and Jobs Act of 2017, signed into law last December, is a $1.5-trillion tax-cutting package. This was followed by a $300-billion federal spending increase. Treasury issuance is headed higher. In May, on a 12-month basis, $494 billion was issued in notes and bonds, up from $335 billion last July.
China recycles its trade surplus with the US – $375.6 billion in goods only in 2017 – into Treasury securities. It likely views these – rightly or wrongly – as its trump card. If and when it begins to seriously unload these, then markets will likely treat this as a signal that a trade spat today has turned into a war, which can bring about higher volatility.
30-year bond: Currently net short 8.7k, down 12.9k.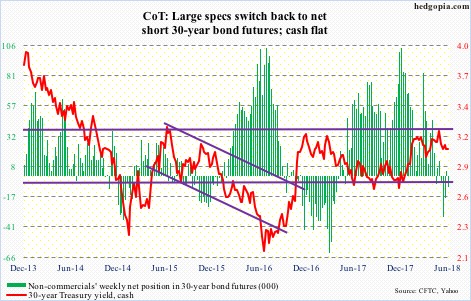
Major economic releases next week are as follows.
New home sales for May are published Monday. Sales fell 1.5 percent m/m in April to a seasonally adjusted annual rate of 662,000 units. Last November’s 712,000 was the highest since October 2007.
The S&P CoreLogic Case-Shiller home price index for April is due out Tuesday. Nationally, prices rose 6.5 percent year-over-year in March – the steepest rise since May 2014.
May’s durable goods orders are on tap Wednesday. Orders for non-defense capital goods ex-aircraft – proxy for business capex plans – rose 5.7 percent y/y to $67.1 billion (SAAR).
Thursday brings the final estimate of 1Q18 GDP. The second estimate showed the economy grew 2.2 percent in the first quarter.
On Friday, personal income and spending (May) and University of Michigan’s consumer sentiment index (June, final) are scheduled.
Core PCE – the Fed’s favorite measure of consumer inflation – increased 1.8 percent in the 12 months to April.
Consumer sentiment rose 1.3 points m/m in May to 99.3. March’s 101.4 was the highest since January 2004.
Crude oil: Currently net long 630.1k, down 41k.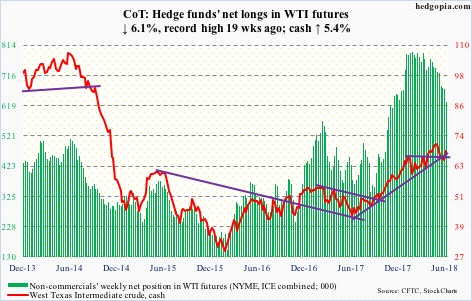
The EIA report for the week of June 15 was mixed.
Both gasoline and distillate stocks rose, up 3.3 million barrels and 2.7 million barrels to 240 million barrels and 117.4 million barrels, in that order. As did crude imports, which increased 143,000 barrels/day to 8.24 million b/d.
Crude stocks, on the other hand, fell 5.9 million barrels to 426.5 million barrels – an 11-week low. Refinery utilization rose a percentage point to 96.7 percent, matching the high of late December last year. Crude production was flat at 10.9 mb/d.
Spot West Texas Intermediate crude ($68.58/barrel) peaked at $72.90 on May 22, followed by a drop to an intraday low of $64.22 in the next nine sessions. That low was breached Monday intraday but saved by close. News Friday that OPEC and its allies including Russia agreed to boost production from next month by one mb/d soothed traders’ sentiment. They have concluded that due to production declines in countries such as Venezuela, Libya and Angola OPEC is not in a position to raise output by the agreed amount. WTI shot up 4.6 percent on Friday. Short covering likely played a role, but the bulls have recaptured $66.50-ish. The week produced a bullish engulfing candle.
E-mini S&P 500: Currently net long 189.2k, up 19.8k.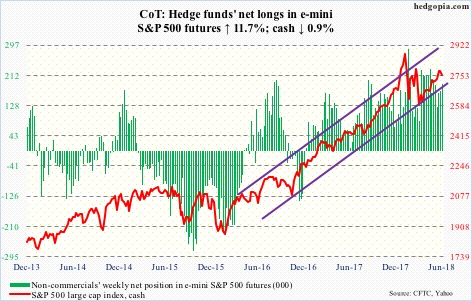
The rectangle breakout three weeks ago was tested a couple of times this week. It is intact thus far. Since making a lower high on June 13, the cash (2754.88) has struggled to regain whatever momentum it had. The daily chart has room to continue lower. If the weekly chart begins to unwind its overbought condition, then weakness can deepen.
Some of the levels worth watching include the 50-day moving average (2714.83). Around 2700, a rising trend line from early February lies. Then there is the 200-day (2663.16), which since February has been defended each time it got tested.
This week’s 0.9–percent loss in the S&P 500 came amidst decent inflows. In the week to Wednesday, ETF.com shows, $2.2 billion moved into SPY (SPDR S&P 500 ETF), $307 million into IVV (iShares core S&P 500 ETF) and $98 million into VOO (Vanguard S&P 500 ETF). However, US-based equity funds (including ETFs) in the same week lost another $1.3 billion – outflows of $15.3 billion in the past three (courtesy of Lipper.com).
Euro: Currently net long 36.1k, down 52.1k.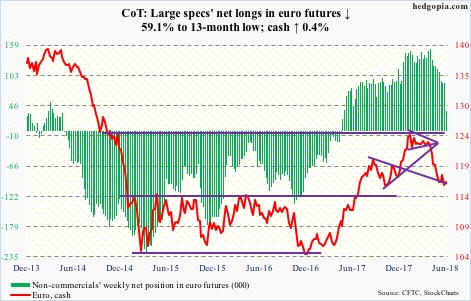
Support at $114-115 was once again tested this week – successfully. After going sideways in a rectangle for nearly two and a half years, the cash ($116.60) broke out of this price point last July. It subsequently rallied to $125.37 in January this year, where it got repelled by a falling trend line from April 2008. Thus the significance of $114-115.
As long as this support holds, the daily chart has room to attract bids. For the week, the euro rose 0.4 percent, digesting the 59.1-percent drop in non-commercials’ net longs well.
Gold: Currently net long 96.5k, down 23.7k.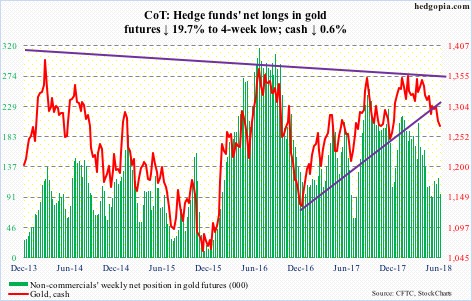
Last week, the cash ($1,270.70/ounce) sliced through trend-line support from December 2016. This opened the door to a test of a similar trend line from December 2015, which would have occurred around $1,250. This week, gold dropped to $1,262.40 intraday Thursday, with the session producing a potential hammer reversal. This support is a must-hold. The metal bottomed at $1,045.40 in December 2015 after peaking at $1,923.70 in September 2011.
Flows continue to be tentative. In the week through Wednesday, IAU (iShares gold trust) lost $124 million, while GLD (SPDR gold ETF) saw no activity whatsoever in eight straight sessions (courtesy of ETF.com).
Nasdaq 100 index (mini): Currently net long 22.8k, up 14.4k.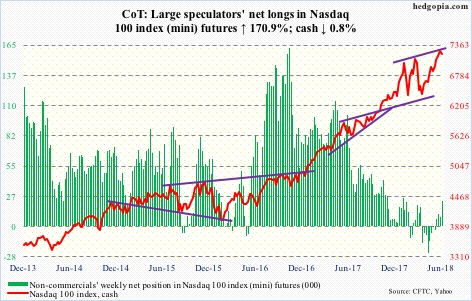
Yet another new high on the cash (7197.51), but not before sellers show up Thursday. If further weakness develops – path of least resistance, at least near term – it would have come at an interesting place. Since early February, the Nasdaq 100 has made higher lows and higher highs. The upper bound of this ascending channel was just tested. The daily chart just formed a potentially bearish MACD cross-under. The week produced a long-legged doji.
In this scenario, bulls need to step up. They did that in the week ended Wednesday, with QQQ (PowerShares QQQ ETF) taking in $1.6 billion. But since February 9 when the index reversed higher after hitting an intraday low of 6164.43, the ETF has only attracted $1.2 billion.
Russell 2000 mini-index: Currently net long 67.5k, down 1.1k.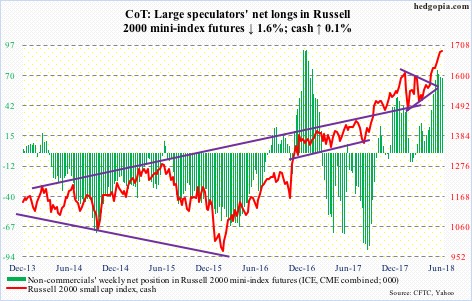
Since early May, flows into IWM (iShares Russell 2000 ETF) have alternated between negative and positive. In the latest week through Wednesday, flows were positive – $1 billion; IJR (iShares core S&P small-cap ETF) too saw $280 million come in (courtesy of ETF.com).
It was another positive week for the cash (1685.58) – eighth in a row – but barely, up 0.1 percent. This time around, the weekly candle had a long wick. The daily chart is itching to go lower. Too soon to say if this develops into something serious. Small-cap bulls forced a major breakout mid-May. Breakout retest occurs at 1610.
US Dollar Index: Currently net long 18.1k, up 13.4k.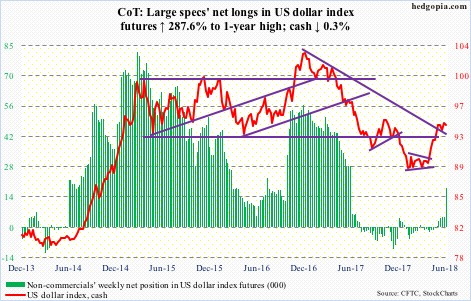
Sellers continued to show up at the 95 level on the cash (94.18). This, even as non-commercials’ net longs rose to a one-year high.
Thursday, the US dollar index rallied to 95.22 intraday before reversing to end the session down 0.3 percent. In October-November last year, it faced resistance at the same level.
The daily chart is extended, but dollar bears would need to push it under 94 to gain the upper hand near term.
VIX: Currently net short 57.6k, up 4.2k.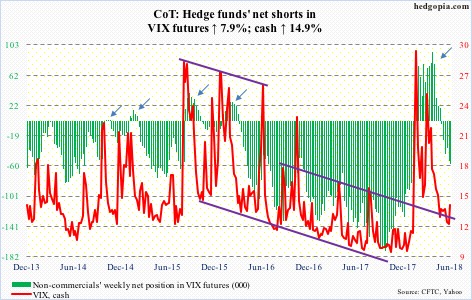
Thursday’s 14.5-percent rally pushed the cash (13.77) slightly past the 200-day, but Friday pushed it back down to literally close on the average. In the right circumstances, volatility has room to rise – if nothing else just to unwind oversold weekly condition.
Elsewhere in the options market, longs’ optimism continues to remain elevated. In all five sessions this week, the CBOE equity-only put-to-call ratio registered readings of .50s. In the past 18 sessions, only 3 were in .60s – low .60s. The 21-day moving average of the ratio closed Friday at .566. Prior to the late-January peak in the S&P 500, the ratio bottomed at .543 on the 26th.
Thanks for reading!
