
Large- and small-cap divergence continues. Versus the Russell 2000 and the Nasdaq 100, the S&P 500 is beginning to show signs of fatigue.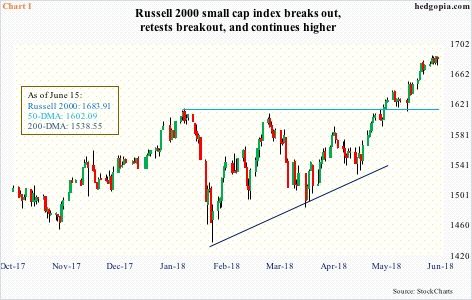
Large-caps continue to fall behind small-caps. Not to mention tech. The S&P 500 large cap index was flat last week – a doji week. It is struggling to build on rectangle breakout of two weeks ago, and looks fatigued. In the past five sessions, the daily chart produced one shooting star, two dojis and one hanging man.
Not so with the Russell 2000 small-cap index and the Nasdaq 100 index. They were respectively up 0.7 percent and 1.4 percent last week. The Russell 2000 broke out (1683.91) a month ago, followed by a successful retest (Chart 1). Of major US equity indices, it was the first to sustainably rally to a new high in the wake of the selloff late January-early February. The S&P 500 is still below its late-January high.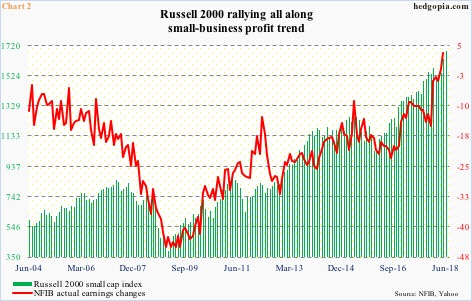
Small-caps’ relative outperformance coincides with persistent strength in small-business optimism. In October 2016, the NFIB optimism index read 94.9. Post-presidential election in November that year, optimism shot up, with May this year at 107.8, up three points month-over-month. This was the second highest reading in the survey’s 45-year history (monthly data goes back to 1986).
Of note, the ‘actual earnings changes’ sub-index in May rose to a new high – at plus three. This metric measures small businesses’ current profit picture, and they are very happy with it. Particularly this year, the red line in Chart 2 surged, with last December at minus 15. The Russell 2000 is in tow.
The Nasdaq 100 index (7255.76) has now joined the Russell 2000. The former rallied to a new high last week. In fact, after peaking late January and bottoming early February, the Nasdaq 100 rallied to a new high mid-March, but that proved fleeting. The breakout was false. The subsequent drop tested the February low but with a higher low. It has more or less rallied non-stop in the past seven weeks.
Chart 3 plots the ISM manufacturing index against year-over-year change in the Nasdaq 100. They follow each other well. US manufacturing is strong. May was up 1.4 points m/m to 58.7, within striking distance of February’s 60.8, which was the highest since May 2004. It is hard to sustain this pace.
Tech bulls still carry the momentum, but in a scenario in which manufacturing weakens, it is hard to keep up the momentum. The daily chart is extremely overbought; ditto with the Russell 2000. The Nasdaq 100 in particular is currently testing nearly six-month trend-line resistance. This is an opportunity for the bears, if they can cash in.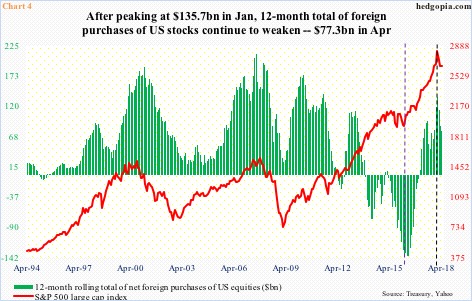
Foreigners have started to cut back. In Chart 4, the green bars and the red line tend to move in tandem. In the 12 months to February 2016, foreigners sold a massive $145.3 billion in US equities, before peaking (indigo vertical dashed line). Stocks reached a major low in that very month. This January, their purchases peaked at $135.7 billion (black vertical dashed line). Once again, the S&P 500 peaked in that month. In April, foreigners’ purchases shrunk to $77.3 billion.
If past is prologue, bulls would not want those green bars to continue to shrink. This is a medium- to long-term worry. Near-term, the options market is beginning to signal elevated optimism.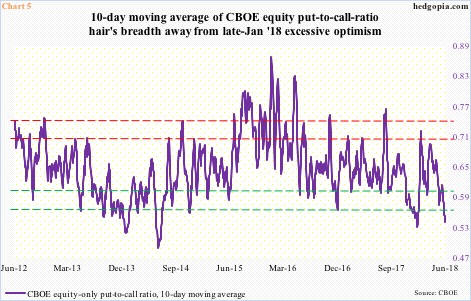
In 10 of last 13 sessions, the CBOE equity-only put-to-call ratio registered readings of .50s or lower, with one in high-.40s. The 21-day moving average Thursday dropped to .569. For comparison, prior to the late-January peak in US equities, the ratio bottomed at .543 on the 26th, before rising.
Chart 5 calculates the same ratio but averaging the last 10 sessions. Last Thursday, it dropped to .535. On January 26 when the S&P 500 peaked, this bottomed at .524. Investor optimism remains very high, even as some level of fatigue is beginning to show up.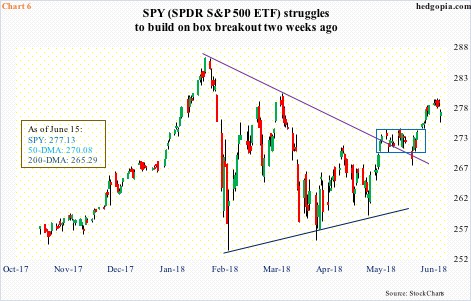
As mentioned earlier, there were several indecision candles last week on the S&P 500. Ditto of course with SPY (SPDR S&P 500 ETF). The rectangle breakout from two weeks ago was just about tested last Friday (Chart 6), and likely gets tested again. The daily chart is overbought, with several momentum indicators beginning to roll over.
It is worth pointing out that in the week to last Wednesday a combined $4.1 billion came out of three S&P 500-focused ETFs – $482 million from SPY (SPDR S&P 500 ETF), $2.8 billion from IVV (iShares core S&P 500 ETF) and $771 million from VOO (Vanguard S&P 500 ETF). This was preceded by outflows of $702 million in the prior week. These outflows followed eight straight weeks of inflows.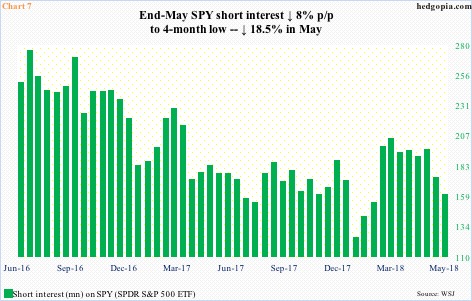
This is occurring even as potential fuel for squeeze is drying up, or drier than a month ago. Short interest on SPY decreased 18.5 percent in May. SPY rallied 2.4 percent in that month. Short interest is still up 27.9 percent this year, but much lower versus recent highs (Chart 7). Near term, bears have an opening.
Last week, hypothetically a June 15/June 29 280 call calendar spread was initiated for a debit of $0.54. The June 15 short call, which collected $0.61 in premium, expired out of the money. The June 29 long call, which was bought at $1.15, is selling at $0.75. Closure of the spread nets $0.21. However, in a likely scenario in which SPY goes sideways to down this week, there is an opportunity for more theta capture by selling June 22 280 call for $0.28. Amount at risk now drops to $0.26.
Thanks for reading!
