
Following futures positions of non-commercials are as of July 17, 2018.
10-year note: Currently net short 469.1k, up 30k.
Speaking to Congress in his Humphrey-Hawkins testimony this week, Jerome Powell, Fed chair, downplayed the risks posed by debt, saying nothing is flashing red. He did mention the rise in non-financial corporate debt, but is not alarmed by household debt.
Here are some stats.
In the current recovery, which just completed nine years, household debt (mortgage and consumer debt) went from $13.2 trillion in 2Q09 to $14 trillion in 1Q18, non-financial corporate debt from $6.5 trillion to $9.1 trillion, and US debt from $11.5 trillion to $21.1 trillion. On the latter, the debt-to-GDP (nominal) ratio jumped from 0.81 to 1.1 (has been one or above since 4Q12).
Hence the question, will this statement come back to haunt Mr. Powell in the future? There are precedents.
Ben Bernanke famously said in July 2005 that “we’ve never had a decline in house prices on a nationwide basis”, implying that prices will probably continue to rise. He took over from Alan Greenspan in February 2006. When Mr. Bernanke made those comments, he was a Fed governor.
His predecessor in October 2004 said “improvements in lending practices driven by information technology have enabled lenders to reach out to households with previously unrecognized borrowing capacities.” To his credit, in June 2005 Mr. Greenspan did say there were signs of “froth” in some local markets, although he did not think a “bubble” in home prices for the nation as a whole appeared likely.
We all know how housing ended. The 2008 credit crisis was the worst since Great Depression.
Janet Yellen, who succeeded Mr. Bernanke in February 2014, had this to say in November 2010, “For my own part, I did not see and did not appreciate what the risks were…I did not see any of that coming until it happened.”
30-year bond: Currently net long 17k, up 8.6k.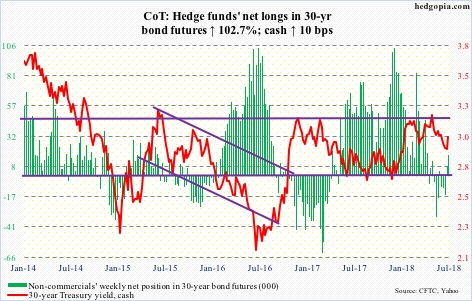
Major economic releases next week are as follows.
Existing home sales for June are scheduled for Monday. Sales dropped 0.4 percent month-over-month in May to a seasonally adjusted annual rate of 5.43 million units. Sales reached 5.72 million last November, which was the highest since February 2007.
June’s new home sales come out Wednesday. Sales in May jumped 6.7 percent to 689,000 units (SAAR). Last November’s 712,000 was the highest since October 2007.
Thursday brings durable goods orders for June. Orders for non-defense capital goods ex-aircraft – proxy for business capex plans – increased 6.5 percent year-over-year to $68.1 billion (SAAR). Orders peaked at $70 billion in March 2012.
GDP (2Q18, advance) and University of Michigan’s consumer sentiment index (July, final) are on tap Friday.
Real GDP grew two percent in 1Q, which was the slowest in four quarters. As of July 18, the Atlanta Fed’s GDPNow model forecasts 4.5 percent growth in 2Q.
Preliminarily, July consumer sentiment fell 1.1 points m/m to 97.1. March’s 101.4 was the highest since January 2004.
Crude oil: Currently net long 682.2k, down 26.8k.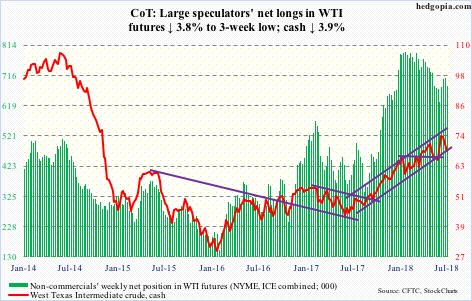
Spot West Texas Intermediate crude ($68.26/barrel) began the week with a loss of the 50-day moving average, until $66-67 was tested. This support drew bids. Medium term, the crude can continue lower, but near term there is room for a test of broken-support-turned-resistance at $69-69.50. The 50- day lies at $69.27.
The EIA report for the week of July 13 showed crude stocks jumped 5.8 million barrels to 411.1 million barrels. The prior week was the lowest since February 2015. Crude imports increased 1.64 million barrels/day to 9.07 mb/d. Crude production rose 100,000 b/d to 11 mb/d. Prior to this, production was stuck at 10.9 mb/d for five weeks. Refinery utilization dropped 2.4 percentage points to 94.3 percent.
Gasoline stocks, on the other hand, fell 3.2 million barrels to 235.8 million barrels. Ditto distillate stocks, which were down 371,000 barrels to 121.3 million barrels.
E-mini S&P 500: Currently net long 183k, up 11k.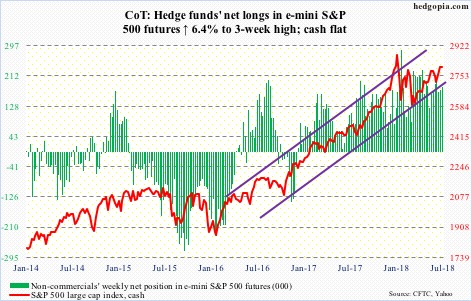
The cash (2801.83) peaked on January 26 at 2872.87, followed by a sharp drop into a reversal low on February 9. Since then, it traded within a rectangle. Shortly thereafter, a rising channel developed. The S&P 500 this week feebly broke out of the rectangle at 2800, but the upper bound of the channel would not be tested until 2840. Wednesday, it rose as high as 2816.76.
The daily chart is way overbought. Odds are bulls will have difficulty defending the rectangle breakout. The 50-day rests at 2751.32.
In the meantime, after losing $45.4 billion in six weeks of outflows, US-based equity funds (including ETFs) in the week through Wednesday gained $1.1 billion (courtesy of Lipper.com). In the same week, SPY (SPDR S&P 500 ETF) took in $369 million, IVV (iShares core S&P 500 ETF) $54 million and VOO (Vanguard S&P 500 ETF) $201 million (courtesy of ETF.com). The S&P 500 was flat this week, with a doji.
For what it is worth, foreigners continue to reduce exposure to US stocks.
Euro: Currently net long 21.4k, down 3k.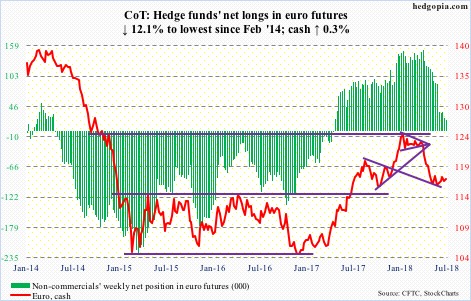
In a doji session Monday, the cash ($117.24) was rejected at a declining 50-day. The subsequent drop saw buyers show up just above the daily lower Bollinger band Thursday when it reversed higher from an intraday low of $115.75. The 50-day was won over Friday.
The currency could very well be in the process of hammering out a bottom.
Support at $114-115 is a must-hold. After going sideways in a rectangle for nearly two and a half years, the euro broke out of this level last July.
Gold: Currently net long 57.8k, down 23.6k.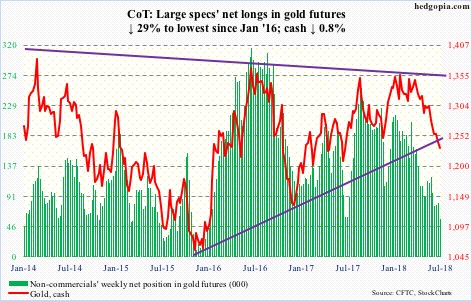
There goes that support. The cash ($1,231.10/ounce) this week lost a trend line from December 2015 when gold bottomed at $1,045.40. This preceded a peak at $1,923.70 in September 2011.
After slicing through the trend line Tuesday, gold kept going lower Wednesday and Thursday but bids started to show up, with both those sessions ending with hammer candles. Ditto Friday. As much as they have gotten beaten up the past three months, this should give gold bugs some hope. Nearest resistance lies at $1,240.
Flows are worth watching. In the week to Wednesday, GLD (SPDR gold ETF) and IAU (iShares gold trust) kept bleeding, down $201 million and $108 million respectively (courtesy of ETF.com).
Nasdaq 100 index (mini): Currently net long 39.2k, up 17.6k.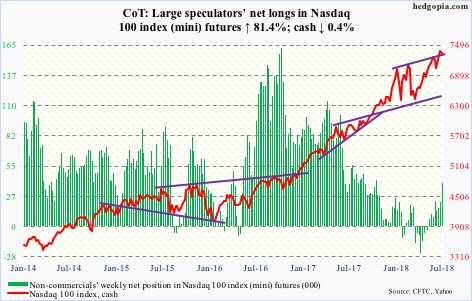
The cash (7350.23) made yet another high Tuesday (7418.43), once again kissing the upper bound of an ascending channel from January. Flows were in full cooperation.
In the week ended Wednesday, QQQ (PowerShares QQQ ETF) attracted $1.7 billion (courtesy of ETF.com). This followed $568 million in outflows in the prior three weeks. For the week, however, the Nasdaq 100 fell 0.4 percent. The daily chart is extremely overbought. The path of least resistance is down – at least near term.
Russell 2000 mini-index: Currently net long 41.1k, down 3.6k.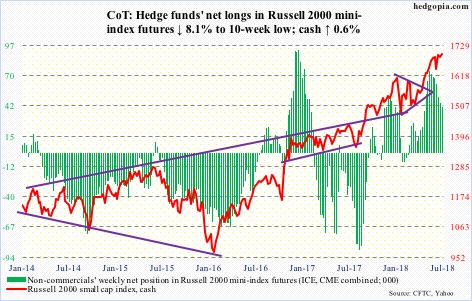
Last week, the cash (1696.81) rose to a new intraday high of 1708.56, but that hardly surpassed the prior high of 1708.10 from June 20. Bulls are not giving up that easy, though. They defended the 20-day late last week and this week. For what it is worth, on the daily chart a one-month cup-and-handle is forming. Should the pattern complete, the Russell 2000 likely gets another tailwind.
At least until Wednesday, this was not a scenario being bet on. In the week ended that session, IWM (iShares Russell 2000 ETF) lost $536 million and IJR (iShares core S&P small-cap ETF) $55 million (courtesy of ETF.com).
US Dollar Index: Currently net long 18.9k, up 239.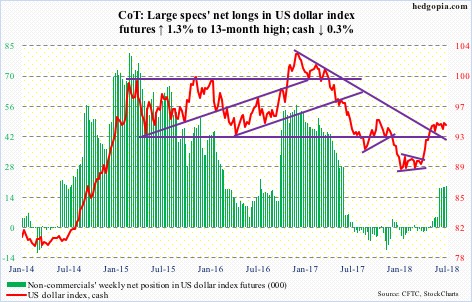
Dollar bulls launched one more assault on 95-plus, and yet again they were denied. The cash (94.23) faced resistance at that level for a whole month before retreating from an intraday high of 95.25 on June 28. Thursday, the US dollar index rallied all the way to 95.44 intraday, only to close at 94.94, in the end producing a candle with a long wick. Friday, it dropped 0.8 percent. The 50-day (94.03) is a hair’s breadth away. Odds favor it will be lost.
VIX: Currently net short 71.8k, up 19k.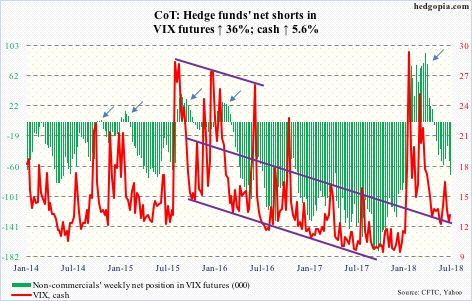
In the last nine sessions, volatility bears succeeded in pushing the cash (12.86) sub-12 intraday five times, including Tuesday and Wednesday this week, but not sub-11. This support has held for the past six weeks, and likely will continue to do so. The daily chart is itching to move higher.
Interestingly, the 21-day moving average of the CBOE equity-only put-to-call ratio closed the week at 0.615. Earlier on June 26, the ratio dropped to 0.56, which reflects elevated investor optimism. This needs to unwind, which is yet to occur in earnest. But there is time. The ratio can rise to high-0.60s/low-0.70s, which is where investor sentiment often tends to bottom.
Thanks for reading!
