
Following futures positions of non-commercials are as of July 11, 2017.
10-year note: Currently net long 257k, down 5.9k.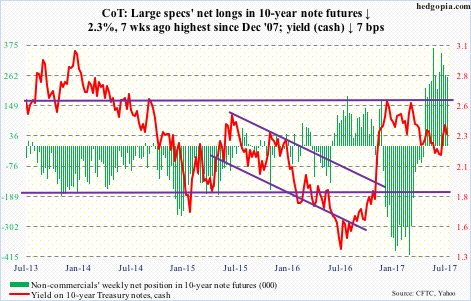
On Tuesday, markets interpreted Fed Chair Janet Yellen’s Humphrey Hawkins testimony as dovish. Ten-year T-yields fell four basis points to 2.33 percent. Concurrently, the S&P 500 large cap index rose 0.7 percent to within 10 points of its June 19 all-time high of 2453.82, which was later surpassed on Friday.
Was this overreaction? Or, was the testimony just a pretext and these assets were taking a cue from overbought/oversold technicals?
In her prepared testimony, Ms. Yellen said: “Because the neutral rate is currently quite low by historical standards, the federal funds rate would not have to rise all that much further to get to a neutral policy stance.”
This probably led market participants to conclude that her message had turned much more dovish. Below is a comparable passage from the June 14 FOMC statement.
“The Federal funds rate is likely to remain, for some time, below levels that are expected to prevail in the longer run.” The message a month ago was gradual rate increases, which is what she implied this week, and which is what markets had been expecting all along.
When the FOMC hiked last December, they wanted to hike at least three more times this year. There have been two 25-basis-point increases. If we are to go by what futures are implying, none of the four meetings prices in 50 percent odds of a hike, with December at 43 percent.
As well, the yield curve (10s/2s) is lower versus when the Fed moved in December 2015, even as 10-year yields are flat. It is just the short end that has moved up.
Markets were always expecting a gradual tightening cycle, with the long end in particular warning that a tighter policy would end up hurting the economy.
30-year bond: Currently net long 50.4k, down 16.6k.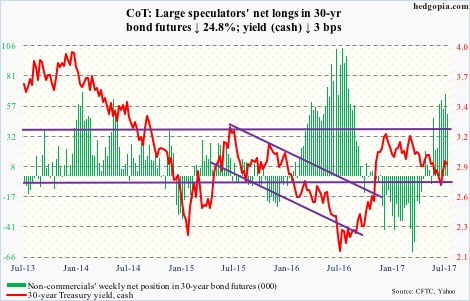
Major economic releases next week are as follows.
Tuesday brings the NAHB housing market index (July) and the Treasury International Capital (May).
Homebuilder sentiment fell two points month-over-month to 67 in June. The cycle high 71 was reached in March this year, which was the highest since June 2005.
In the first four months this year, foreigners purchased $45.7 billion in U.S. equities. On a 12-month rolling total basis, they bought $58.6 billion worth in April. This is a massive reversal from February last year when they sold $142 billion worth – a record – before reversing. Incidentally, U.S. stocks bottomed in that month.
Housing starts for June are due out Wednesday. May starts were down 5.5 percent m/m to a seasonally adjusted annual rate of 1.09 million units. Starts peaked at 1.33 million last October – the highest since August 2007.
Crude oil: Currently net long 393.1k, up 15.2k.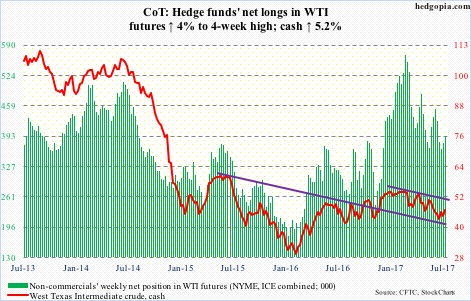
Last week, spot West Texas Intermediate crude retreated after rallying to $47.32/barrel. The 50-day moving average lied there. Plus, $47 faces horizontal resistance going back nearly four months. This week, the crude went after that resistance again – rallied to $46.74 – before closing near the 50-day ($46.58).
From the bulls’ perspective, the good thing is that the 50-day is beginning to go flat. Should the average be taken out, the next resistance lies at $50, which is where a trend line from February this year lies. The 200-day is at $49.59.
The EIA report for the week ended July 7, out Wednesday, probably helped the bulls more than hurt.
Crude stocks, having peaked at 535.5 million barrels late March this year, continued to drop, down 7.6 million barrels to 495.4 million barrels.
Gasoline stocks fell 1.6 million barrels to 235.7 million barrels – a 27-week low.
Crude imports declined 132,000 barrels per day to 7.61 million b/d. This was a 17-week low.
Refinery utilization rose nine-tenths of a point to 94.5 percent. The downside is that, as high as utilization is, the path of least resistance in the weeks ahead is likely down.
Also, distillate stocks were up 3.1 million barrels to 153.6 million barrels – a 16-week high.
Crude production, too, rose 59,000 b/d to 9.4 mb/d. Since OPEC reached an agreement to cut back production by 1.8 mb/d last November, U.S. production has gone up by 700,000 b/d. Plus, Nigeria and Libya collectively have upped production by nearly 400,000 b/d.
E-mini S&P 500: Currently net long 78.6k, up 9k.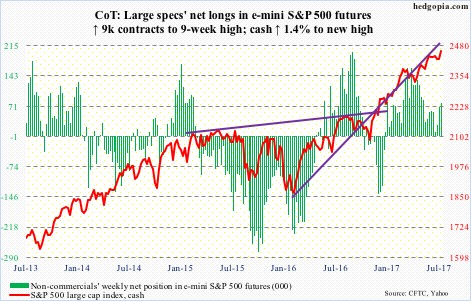
The 50-day was defended again this week, followed by a break Wednesday out of a declining trend line from June 19 when the cash rose to 2453.82, and then a new high Friday in a low-volume session. The new number to beat: 2463.54.
Leading up to Friday’s breakout, the S&P 500 had essentially gone sideways for six weeks. SPY (SPDR S&P 500 ETF) shorts were acting as if they expect a breakout. With 2Q17 operating earnings estimates of S&P 500 companies down $0.83 in April-June, and by another $0.04 since the quarter ended, the bar is low. Enough to jump over and be a catalyst to attract funds? Fingers crossed!
In the week ended Wednesday, U.S.-based equity funds did bring in $3.5 billion. This followed outflows of $15.2 billion in the past three (courtesy of Lipper).
In the same week, SPY lost $194 million (courtesy of ETF.com). This, however, was offset by inflows of an equal amount into IVV (iShares core S&P 500 ETF) and VOO (Vanguard S&P 500 ETF) – $182 million and $12 million, respectively.
Euro: Currently net long 83.8k, up 6.3k.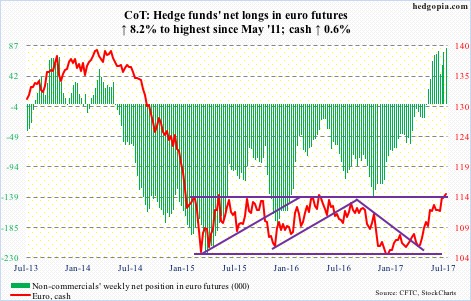
The cash has essentially been trapped in a rectangle for two and a half years, and is currently at the top of the range. In fact, on a closing basis, the euro (114.67) has managed to poke its head out of that resistance. Non-commercials are piling on.
That said, the chart is increasingly overbought on both daily and weekly basis. Nearest support lies at 113.
Gold: Currently net long 60.3k, down 33.5k.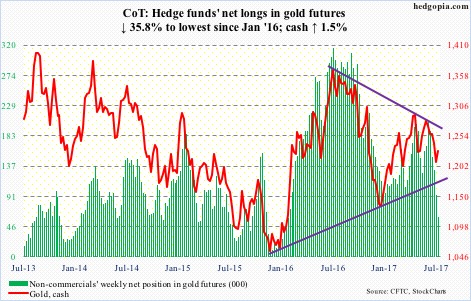
GLD (SPDR gold ETF), lost another $314 million in the week through Wednesday (courtesy of ETF.com). This came on the heels of redemptions of $566 million in the prior three. Non-commercials, too, cut net longs to lowest since January last year.
Despite this, gold bugs put their foot down by defending the $1,200/ounce level.
Friday, the cash rallied 0.8 percent but was rejected at the 200-day. The 50-day ($1,247.47) lies above, followed by $1,270, which represents a falling trend line from a year ago. Down below, $1,180 represents support from a rising trend line from November 2015.
The metal is still caught between the two.
Nasdaq 100 index (mini): Currently net long 30.7k, down 7.8k.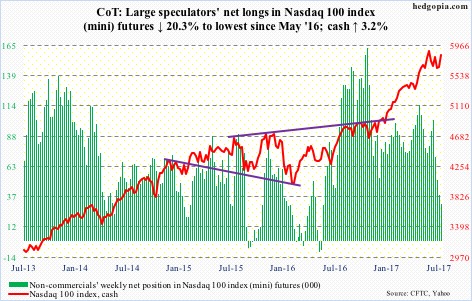
The cash pushed off of the bottom of a short-term channel, subsequently breaking out on Thursday. The 50-day has been recaptured.
Flows helped.
In the week ended Wednesday, $2.4 billion moved into QQQ (PowerShares Nasdaq 100 ETF), reversing outflows in the prior four during which $3 billion was withdrawn (courtesy of ETF.com).
Shorts likely lent a helping hand as well. Short interest on QQQ, XLK (SPDR technology ETF), or the Nasdaq composite for that matter, remains elevated. If earnings cooperate and the bulls press further, there is more fuel for squeeze.
Russell 2000 mini-index: Currently net short 37.5k, down 19.6k.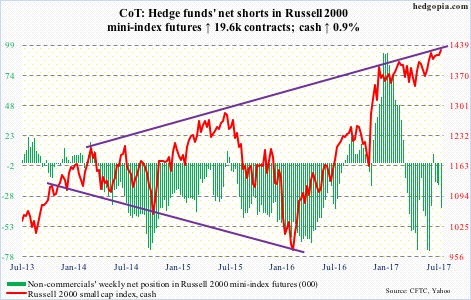
One more week and one more attempt by the cash at resistance.
The Russell 2000 – sideways for several weeks – managed to push above a multi-month rectangle between 1340s and 1390s, but at the same is being held down by the upper bound of a rising channel.
A breakout will be big, provided it is genuine – not good if it just takes out stops and then peters out.
In this respect, in the week to Wednesday, IWM (iShares Russell 2000 ETF) lost $267 million (courtesy of ETF.com). This was preceded by redemptions of $1.3 billion in the prior two. Year-to-date, it has lost $2.2 billion.
US Dollar Index: Currently net long 2.3k, down 3.5k.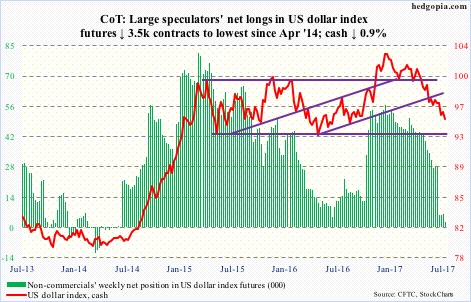
The cash (94.93) tried very hard to stabilize for 10 sessions, only to get slammed on Friday. The 10-day repelled rally attempts in the past 11 sessions, with 95.25 now resistance, followed by 96.50.
The incessant drop this year is yet to excite non-commercials. It is possible they are waiting to see what transpires when 93-plus – bottom of two-plus-year range – is tested.
VIX: Currently net short 110.3k, down 13.3k.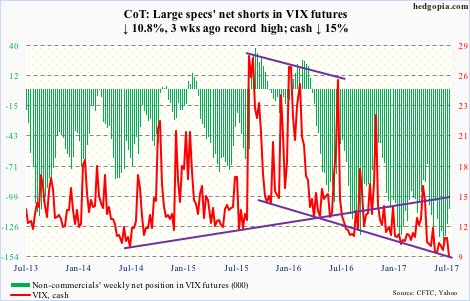
July is only halfway through, so anything can happen in the other half. But thus far the cash only managed to rise to 13.05 (on the 6th) before reversing hard. In the prior four months, sellers showed up only after VIX rallied to north of 15-16.
Both Thursday and Friday, VIX closed below 10, preceded by a loss of the 50-day on Wednesday. Consolation for volatility bulls: the average is no longer dropping fast, as was the case particularly in May and June.
Thanks for reading! Please share.
