
Following futures positions of non-commercials are as of April 16, 2019.
10-year note: Currently net short 275.7k, up 14.1k.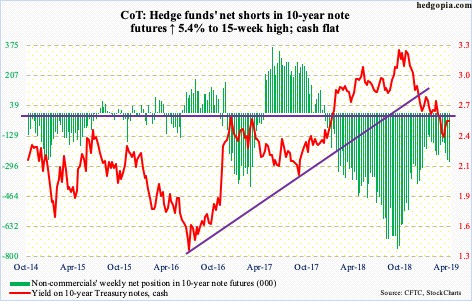
The support-turned-resistance at 2.62 percent was tested – unsuccessfully – Wednesday when the 10-year yield (2.56 percent) rallied to 2.61 percent. This is a crucial level going back a decade. Thursday, yields fell three basis points – now below the 50-day (2.59 percent). Bond bears got no help from Thursday’s better-than-expected retail sales data for March.
Prior to this, the 10-year bottomed at 2.36 percent on March 27. For now, the daily wants to go lower. In the right circumstances for bond bulls, non-commercials will begin to cover their net shorts, which are nowhere as high as last September’s record, but decent enough to potentially put downward pressure on yields.
30-year bond: Currently net short 24.6k, down 743.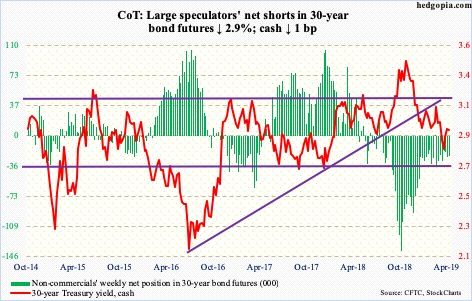
Major economic releases next week are as follows.
Existing home sales for March are due out Monday. Sales jumped 11.8 percent month-over-month in February to a seasonally adjusted annual rate of 5.51 million units. In November 2017, sales reached a cycle high 5.72 million units.
March’s new home sales are on tap Tuesday. February was up 4.9 percent m/m to 667,000 units (SAAR). A cycle high 712,000 units was reached in November 2017.
Thursday brings durable goods for March. February orders for non-defense capital goods ex-aircraft – proxy for business capex plans – were up 2.6 percent year-over-year. Orders have softened since last July’s 8.8-percent pace.
On Friday, 1Q real GDP (first estimate) and the University of Michigan’s consumer sentiment index (April, final) come out.
Real GDP grew 2.2 percent in 4Q18, having decelerated from 4.2 percent in 2Q and 3.4 percent in 3Q. As of Thursday, the Atlanta Fed’s GDPNow model forecasts 1Q growth of 2.8 percent.
Preliminarily, consumer sentiment in April fell 1.5 points m/m to 96.9. The 101.4 reading in March last year was the highest since January 2004.
Crude oil: Currently net long 619.1k, up 708.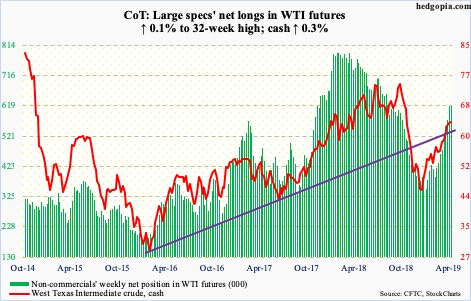
The EIA report for the week ended April 12 showed improvement in several metrics. Crude imports fell 607,000 barrels per day to six million bpd. This was the lowest total since February 1995. Crude production dropped 100,000 bpd from record 12.2 mbpd. Refinery utilization inched up two-tenths of a percentage point to 87.7 percent. Stocks of crude, gasoline and distillates all declined – respectively by 1.4 million barrels, 1.2 million barrels and 362,000 barrels to 455.2 million barrels, 228 million barrels and 127.7 million barrels.
Bulls were not quite able to cash in on it. The cash ($64.07/barrel) rose 0.3 percent for the week but produced a spinning top. This followed last week’s candle with a bit of a wick. Daily and weekly momentum indicators are extended. From late December through the intraday high of $64.79 eight sessions ago, the crude jumped 53 percent. Digestion of these gains is the path of least resistance. Nearest support lies at $63. The 200-day moving average lies at $61.39.
E-mini S&P 500: Currently net long 16k, up 19.1k.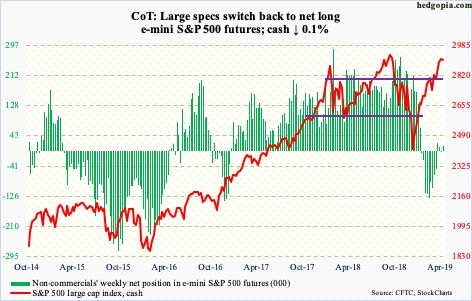
Wednesday’s intraday high of 2918 came within 0.8 percent from the record high set last September, but bulls were not able to latch on to the gains. The cash (2905.03) fell 0.1 percent for the week and saw a weekly doji. Bulls, whose ranks are growing going by the weekly Investors Intelligence survey but not giddy yet, must be disappointed for not having done better because flows were great.
In the week through Wednesday, SPY (SPDR S&P 500 ETF), VOO (Vanguard S&P 500 ETF) and IVV (iShares core S&P 500 ETF) gained a combined $7 billion. This followed inflows of $8.8 billion in the prior two weeks (courtesy of ETF.com). In the same week, US-based equity funds took in $5.5 billion. Last week, these funds attracted $4.3 billion (courtesy of Lipper). Lipper also shows that a massive $54.5 billion left money-market funds. According to ICI, money-market assets ended Wednesday at $3.04 trillion, down $69.9 billion from the high set early March. Bulls obviously hope this trend continues. At the same time, they are also having to grapple with stretched technicals as well as multiples. From late December through this week’s high, the S&P 500 rallied north of 24 percent.
Shorter-term moving averages seem to be wanting to at least go flat. For bears to get traction, this should continue and eventually point lower. Should this scenario come to pass, 2800 is where the next tug of war takes place. The 50-day (2815.63) lies around there as well.
Euro: Currently net short 98k, down 4.2k.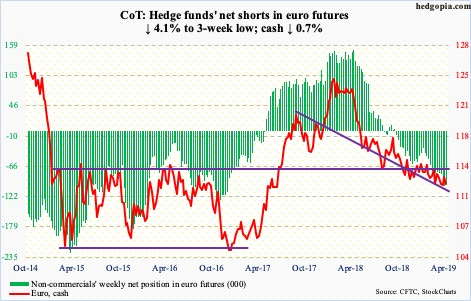
Once again, the 50-day came in euro bulls’ way. After straddling the average for four sessions, the cash (112.31) fell 0.6 percent Thursday – below its 10- and 20-day. Once again, the currency is near the bottom of a five-month range. Bulls cannot afford to lose 112, or 111.80s for that matter.
Gold: Currently net long 56.3k, down 49.1k.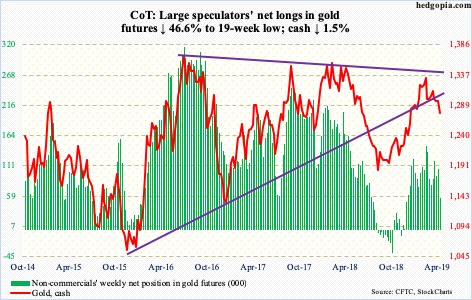
Both GLD (SPDR gold ETF) and IAU (iShares gold trust) bled in the week through Wednesday – $77 million and $208 million respectively (courtesy of ETF.com). GLD’s loss followed outflows of $1.1 billion in the prior two weeks.
The cash ($1,276/ounce) lost 1.5 percent this week. Support at $1,280s is gone. That said, the daily in particular is getting oversold. Thursday, a doji showed up right on the daily lower Bollinger band. Gold bugs can still step up and repair the damage. Worse, the 200-day lies at $1,253.31.
Nasdaq 100 index (mini): Currently net short 8.5k, up 15.9k.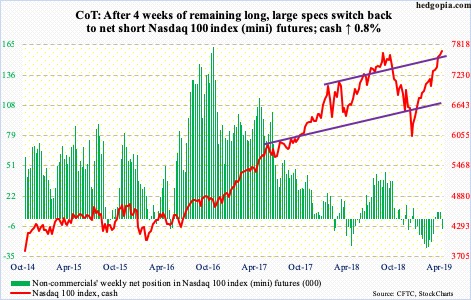
Wednesday’s intraday high of 7715.07 surpassed the prior high of 7700.56 reached early October last year – right before the rug came out of the cash (7689.72) back then. From late December, the Nasdaq 100 is up nearly 31 percent. Kudos to bulls for pulling this off, but the fact remains that large-caps dominate the action. The Nasdaq composite is 1.7 percent from its record high set last August. Further, only 52 percent of Nasdaq stocks are above their 50-day, down from 81.4 percent on February 19, even though the index keeps trudging higher.
Nevertheless, bulls continue to hold the momentum ball. The daily RSI has remained above 70 since early this month. They continue to defend shorter-term moving averages. In the week to Wednesday, QQQ (Invesco QQQ trust) took in $662 million. In the prior week, $1.5 billion came in (courtesy of ETF.com). Too soon to say if these are Johnny-come-latelies or their optimism pays off as the likes of Amazon (AMZN), Apple (AAPL), Microsoft (MSFT), Alphabet (GOOG) and Facebook (FB) report their March quarter.
Russell 2000 mini-index: Currently net short 16.8k, up 6.4k.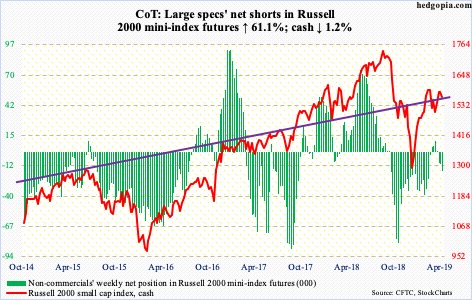
Last Friday’s intraday high of 1589.73 was just about what small-cap bulls could manage in their quest to test 1600. This is an important price point going back to January last year. This week, the cash (1565.75) shed 1.2 percent – the weakest performance among major US equity indices.
In the week to Wednesday, IJR (iShares core S&P small-cap ETF) and IWM (iShares Russell 2000 ETF) respectively lost $433 million and $811 million (courtesy of ETF.com). Non-commercials have remained net short the past three weeks, with an additional 6.4k contracts this week.
The Russell 2000 is caught right between the 50- and 200-day (1556.26 and 1570.36, in that order), with the former providing support Friday. At 1550, a trend line from the lows of late December last year gets tested. Odds favor a breach in the sessions/weeks ahead. The weekly is itching to go lower, with the weekly RSI never having managed to cross 60 since December lows.
US Dollar Index: Currently net long 28.9k, down 508.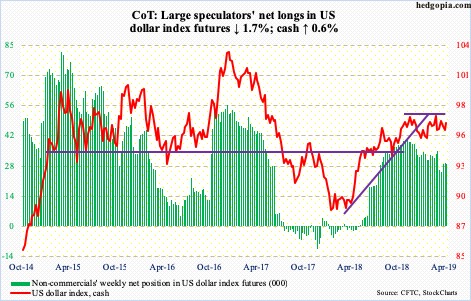
Bulls this week built on last week’s test of trend-line support from last September. Thursday, the cash (96.61) jumped 0.5 percent to reclaim its 50-day. The daily has room to continue higher. Rally attempts have failed at 97 since last August.
VIX: Currently net short 169.9k, up 5.5k.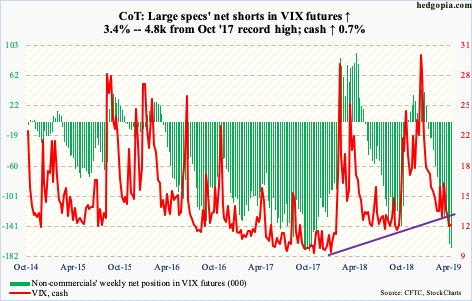
The cash (12.09) rose 0.7 percent for the week, but not before dropping to 11.03 on Wednesday. That was the lowest since last August. The weekly, which remains deeply oversold, produced a spinning top. This is an opportunity for volatility bulls. Let us see if they can make something out of it.
For three months now, VIX got consistently repelled at the 50-day, which now lies at 14.25. The most recent rejection took place eight sessions ago. The average is itching to at least go flat. Once – matter of when, not if – the cash begins to sustainably rally, further help will come from non-commercials, who are sitting on near-record net shorts.
Thanks for reading!
