
U.S. equity bulls stepped up near important support Tuesday. Those lows have now taken on significance. Should there be no violation, the path of least resistance is up – duration and magnitude notwithstanding.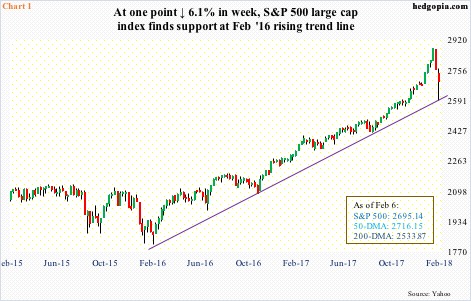
In the early months of 2016, stocks reached a major bottom before rallying. Between November 2015 and February 2016, the S&P 500 large cap index dropped 14 percent. From that low through last week’s high 2872.87, it rallied 59 percent! Hence the significance of a trend line drawn from that low.
Tuesday essentially began where Monday left off, opening down big. At one time, the S&P 500 was down 6.1 percent for the week – down 9.7 percent from last week’s high. Where did the buyers show up? Near the aforementioned trend line, of course (Chart 1).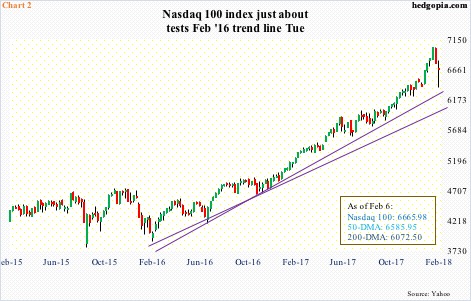
Over on the Nasdaq 100, the story was the same.
Chart 2 draws two trend lines from February 2016 lows, one of which was just about tested Tuesday. Using Tuesday’s lows, it too shed 9.3 percent from record 7022.97 on January 26.
The Nasdaq 100 went on to recapture the 50-day moving average – remained under for one session. The S&P 500 is still below it. Ditto with the Dow Industrials and the Russell 2000 small cap index. The latter, in fact, defended the 200-day on Tuesday.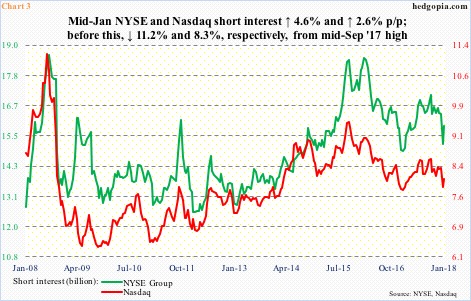
Now what?
The bears got their 10-percent – just about – correction. In all probability, they also got squeezed Tuesday as the session progressed.
Short interest remains relatively elevated. Both NYSE and Nasdaq short interest has declined substantially from February 2016/September 2015 highs, but in the most recent period, which is mid-January, rose 4.6 percent and 2.6 percent period-over-period, in that order (Chart 3).
Several times in the past, short squeeze has provided a tailwind to these indices. The difference this time around is that short interest is nowhere near February 2016 lows in stocks.
Another factor to consider is the flows.
U.S.-listed equity ETF’s took in $30.8 billion in January (courtesy of ETF.com). Three S&P 500-focused ETF’s – SPY (SPDR S&P 500 ETF), VOO (Vanguard S&P 500 ETF) and IVV (iShares core S&P 500 ETF) – alone attracted $28.5 billion.
Similarly, in the four weeks ended Wednesday last week, U.S.-based equity funds (including ETF’s) took in $60.7 billion (courtesy of Lipper.com). These are massive numbers, and could very well represent peak optimism. Time will tell.
Thus far, February has not started out well. Through Monday this week, SPY, VOO and IVV collectively lost $2.1 billion.
Both short interest and the flows trend are factors that can potentially change the risk-reward dynamics in the intermediate term. Near term, different dynamics are in play – volatility being one.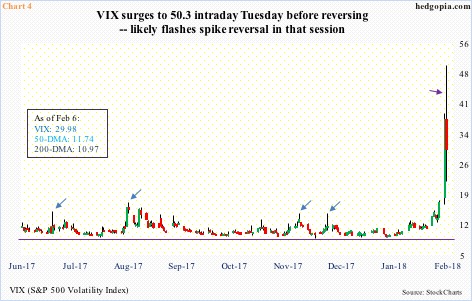
VIX (29.98) surged to 50.3 intraday Tuesday. This was the highest since 53.29 on August 24. But the bulls (volatility) were unable to hang on to those gains. Consequently, Tuesday produced a potential spike reversal (violet arrow in Chart 4). In the past, such reversals have tended to result in unwinding of the kind of daily overbought condition that VIX currently finds itself in (blue arrows).
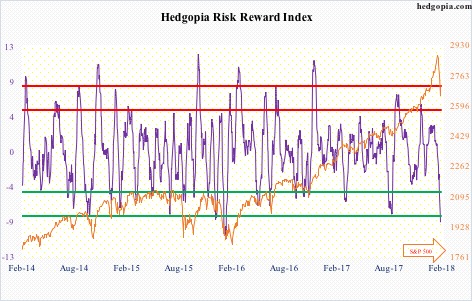
Our own Hedgopia Risk Reward Index has dropped to the green zone.
The question is what kind of unwinding would we see? It is very possible VIX will stabilize at a higher plateau. Even if that were to occur, there is room for volatility to subside, which means there is room for stocks to rally.
Ideally, it would be healthy if the equity indices mentioned above drop to retest Tuesday’s lows. This would also help short-term moving averages begin to at least go sideways. This is where flows play a role, which, in turn, would decide if more squeeze takes place. The other ingredient – oversold condition – is now in place. On the NYSE, Monday produced a 30-to-one down-vs-up volume – ridiculously high. This was preceded by already-high 12-to-1 last Friday. Such readings need to get unwound. Hence decent odds of at least a decent bounce.
Thanks for reading!
