
If small-caps are a gauge of investor mood for risk- on and-off, then they are subtly beginning to lean toward risk-off.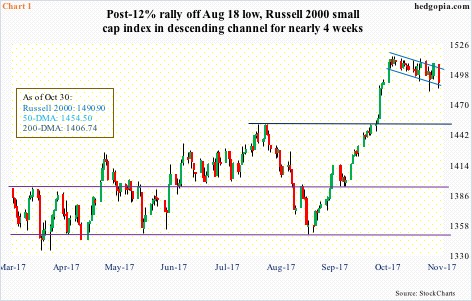
Of the four major U.S. indices – the S&P 500 large cap index, Dow Industrials, Nasdaq composite, and the Russell 2000 small cap index – the latter is the first one to lose both 10- and 20-day moving averages.
The Russell 2000 peaked at 1514.94 on the 5th this month, and has since traded within a descending channel. There have been a few breakout attempts – all unsuccessful. Monday, it closed right on the lower bound (Chart 1).
The latest sideways-to-slightly down action preceded a 12-percent rally off of August 18 reversal. The index remains overbought on nearly all timeframe. Weekly in particular seems to be itching to go lower. In this scenario, the nearest support lies at 1452, with the 50-day at 1454.50.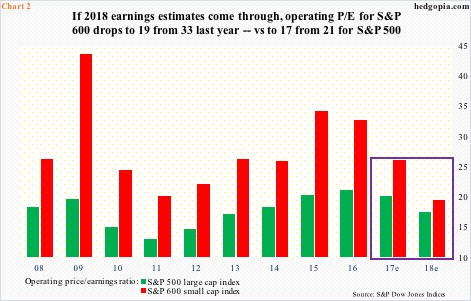
Incidentally, since small-caps began to rally 10 weeks ago, operating earnings for S&P 600 companies have gone from $35.56 to $34.75 for this year and from $46.49 to $46.37 for next. Last year, they earned $25.60.
The revision trend is – and has been – down, but estimates for next year are holding up. If they come through, using the current price of 903.48 for the S&P 600 small cap index, next year’s P/E would drop to 19.5, versus 32.7 in 2016 – quite a contraction (Chart 2). For comparison purposes, if ’18 estimates are realized, the operating P/E for S&P 500 companies drops to 17.5 from 21.1 in 2016.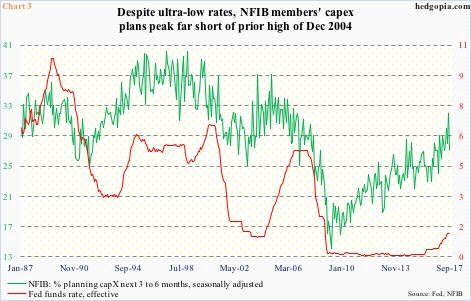
The sell-side’s optimism for next year coincides with persistently optimistic National Federation of Independent Business members.
In September, the NFIB optimism index fell 2.3 points month-over-month to 103. But August’s 105.3 was a stone’s throw away from 12-year high 105.9 in January this year. Optimism took off post-presidential election last year, with the last 10 months north of 100 (not shown here).
These business owners’ plans for capital expenditures, however, do not mimic the spike in their overall optimism.
In September, capX plans declined five points m/m to 27 – essentially sideways going back at least nine years.
The prevailing ultra-low interest rates have not succeeded in coaxing small businesses into aggressively spending on capital projects. Or, maybe the low rates themselves are to blame. The red and green lines in Chart 3 tend to follow each other. Rates have been left artificially low for too long.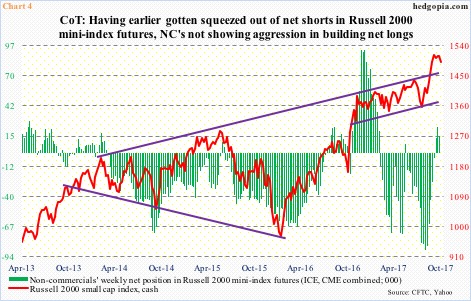
Since the financial crisis, low rates may – or may not – have suppressed capX, but the primary reason why small-caps took off post-election is President Trump’s promises to cut taxes and regulations as well as enhance infrastructure spending. Small businesses inherently are domestically focused.
The latest bottom in the Russell 2000 on August 18 preceded the release by the White House of its tax-reform plan. Then toward the end of August, non-commercials’ net shorts in Russell 2000 mini-index futures bottomed at 87,499 contracts. The squeeze that followed was a massive tailwind for the cash. In the last three weeks, these traders have been slightly net long, but cut back in the latest week (Chart 4).
By the looks of it, they are not interested in aggressively increasing their long exposure. Not when, as stated previously, the Russell 2000 is showing decelerating momentum. Non-commercials tend to be trend followers.
Importantly, the intraday high of 1514.94 early this month represents a 161.8-percent Fibonacci extension of the 27-percent decline between June 2015 and February 2016 (more here). This more often than not acts as resistance. Odds have increased this time around, as non-commercial squeeze fuel is all spent up.
Thanks for reading!
