
It is damage control time for small-cap investors.
When on August 14 August 21st weekly 119 puts were hypothetically sold for $0.92, IWM, the iShares Russell 2000 Index, was trading at $119.62. If the short put got assigned, it was an effective long at $118.08. Support at that area went back to March of last year. The trade was obviously initiated assuming it would not give way. But it did.
In the five days leading up to the intra-day low last Monday, the ETF lost 11 percent (Chart 1). Last week, with a goal of earning premium and reducing the effective cost, weekly August 28th 117 calls were sold for $1.04. The cost dropped to $117.04. It is time to tinker with it again.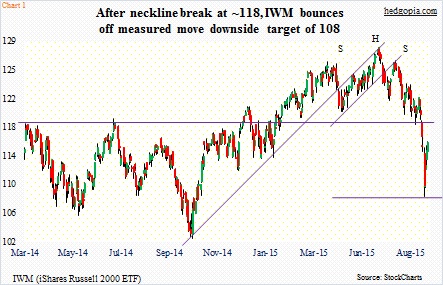
First of all, needless to say, the ETF suffered a waterfall drop lasting five sessions beginning August 18. Even after the recovery last week – up 0.5 percent – IWM is still down a tad over 10 percent off the June 24th high. Off the Monday low, it has rallied 6.8 percent, on par with the 6.5-percent rise in the S&P 500 Index, but much weaker than the Nasdaq Composite’s 12.5-percent surge.
Stocks, small-caps included, have room to do well – if nothing else just to unwind overbought conditions. Several indicators are flashing extreme readings.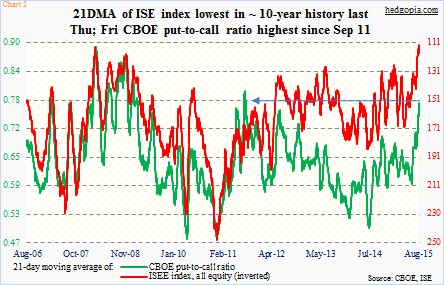
In Chart 2, CBOE and ISE put-to-call ratios are presented. The latter is a call-to-put ratio, and in its 10-year history the 21-day moving average made an all-time low of 112.6 last Thursday, with Friday at 115.5. The CBOE reading in the meantime is yet to peak; Friday was .771 – the highest since September 2011.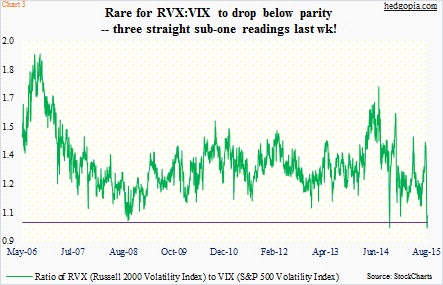
In Chart 3, the ratio of RVX, the Russell 2000 Volatility Index, to VIX, the S&P 500 Volatility Index, made history last week. It is not often the ratio drops below parity. When it does, this has been a good time to buy stocks. The caveat in all this is that RVX only goes back nine years, so not much back-testing can be done. Last week, the first three sessions produced sub-one readings in succession.
The 118 support on IWM also coincided with the neckline of a head-and-shoulders formation (Chart 3). A break of that neckline would give us a downside target to the 108 range, which was met in no time last week. The ETF did indeed bounce off of that level.
These are all good signs.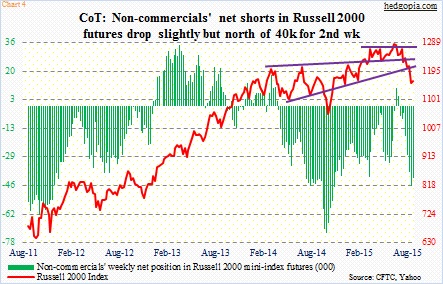
However, the same way the waterfall drop has caught many by surprise, the subsequent bounce/rally has too. Short-covering probably played a role in the rally in the back half of last week. Digestion is highly likely this week.
As far as small-caps are concerned, if we are to go by how non-commercials are positioned, they seem to expect weakness; for the second week, net shorts have been north of 40,000 contracts (Chart 4). Separately on the S&P 500, last Friday produced what looks like a spinning top – a sign of fatigue near-term.
Given all this, another covered call on IWM ($115.62) seems fitting.
Weekly September 4th 115 calls are in the money and fetch $2.11. A covered call, if called away, ensures a closure for a small profit of $0.07 – not bad given the trade was in a bit of a hole initially. If IWM instead comes under pressure and does not get called away, then the effective cost drops further, to $114.93. The idea is to have it called away at best or substantially lower the effective cost at worst.
Thanks for reading!
