
Major equity indices had a good week last week. Stocks are currently in the midst of many crosscurrents, not to mention inflation, aggressive monetary policy and several extended metrics. Even though they have broken out of, or are near, important resistance, it helps to pay attention to immediate support.
Stocks rallied big last week, ranging from the Russell 2000’s 4.3 percent, the S&P 500’s 2.7 percent and the Nasdaq 100’s 2.1 percent.
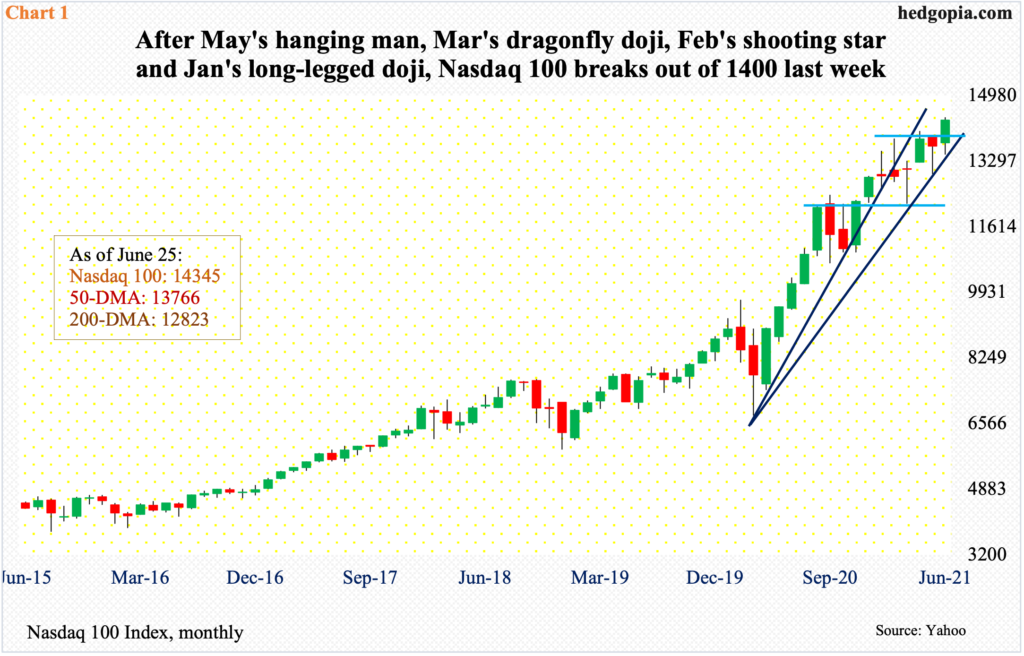
Despite a relatively underwhelming performance by the Nasdaq 100 (14345), it broke out. Having first tried to conquer 14000 in the middle of April, it took tech bulls more than two months before this was achieved.
With three sessions to go, June is up 4.8 percent. This has come after several potentially bearish monthly candles as soon as 2021 began. January formed a long-legged doji, February a shooting star, March a dragonfly doji and May a hanging man.
In February, a rising trend line from March last year was breached. In the meantime, with the passage of time, another trend line from that low can be drawn, with this month’s low defending that support (Chart 1).
Right here and now, momentum lies with the bulls.
The daily is extended. This week, Wednesday and Thursday formed a gravestone doji – all along the sharply rising daily upper Bollinger band. Breakout retest at 14000 is possible.
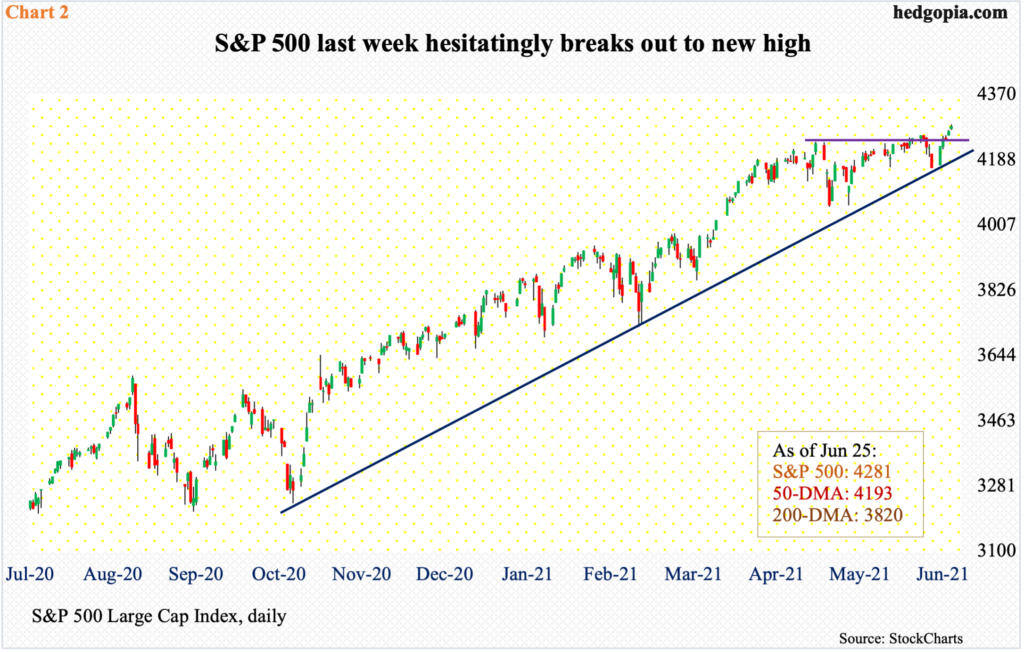
There was a similar breakout on the S&P 500. The large cap index hesitated at/near the June 15 high of 4257 for several sessions before it was surpassed last Thursday, with Friday adding more gains.
The 50-day (4193) has once again been saved. Since May last year, the average has been tested and defended several times, with a few breaches proving temporary. Six sessions ago, the index (4281) closed out just under the average – right on the daily lower Bollinger band. Last Monday’s 2.7-percent rally hurriedly reclaimed the average.
It is possible non-commercials lent a hand in last week’s gains.
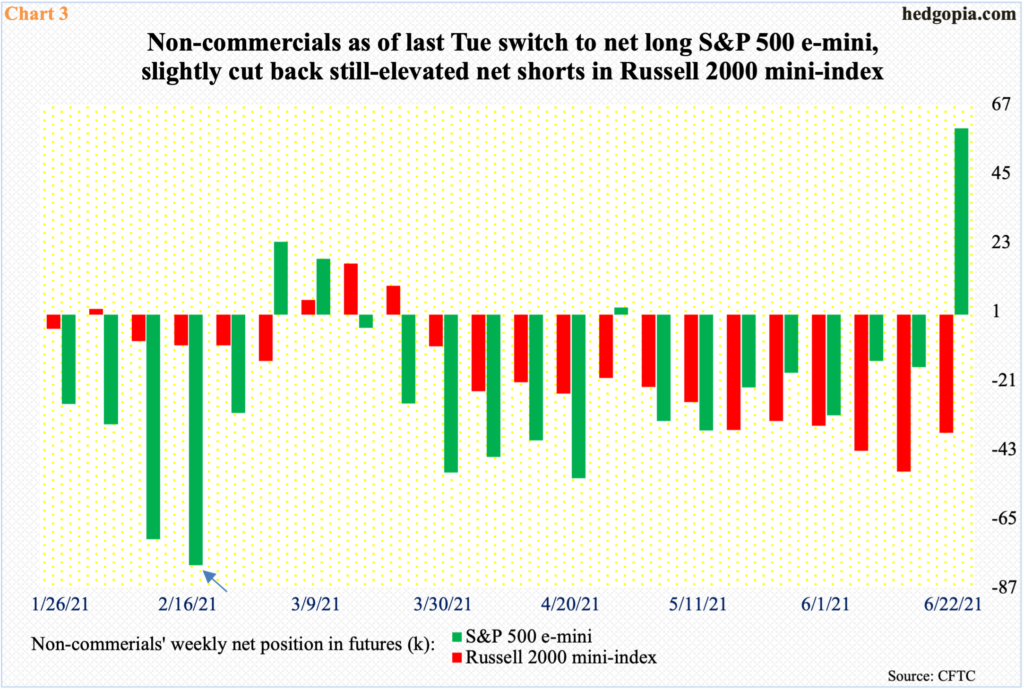
In the futures market, non-commercials staged a huge U-turn last week. As of last Tuesday, they switched from 16.7k in net shorts in the prior week to 59.3k net longs. As a matter of fact, these traders had amassed nearly 80k net shorts by mid-February (arrow in Chart 3). Regardless of cause and effect, they gradually reduced their bearish exposure as the S&P 500 persisted higher.
Elsewhere, small-cap bulls are hoping things will turn out the same way in Russell 2000 mini-index futures. In the prior week, non-commercials held 50k in net shorts which were the highest since September 2019. Last week (as of Tuesday), they reduced those to 37.6k, which is still large enough to meaningfully assist the longs should shorts get squeezed.
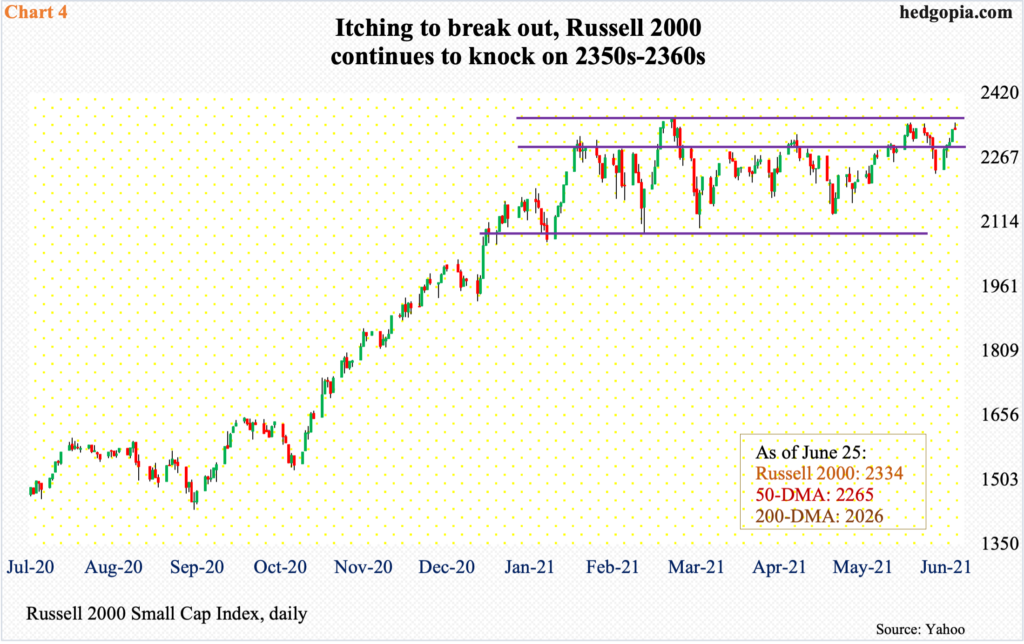
This is happening even as the Russell 2000 sits right underneath crucial resistance.
Mid-March, the small cap index retreated after tagging a new all-time high of 2360. This month, 2350s has been hit a couple of times, with a few more touching 2340s. Last Friday, bulls went after the ceiling again tagging 2350 intraday but only to reverse and close at 2334, above horizontal support at 2280s (Chart 4).
At this juncture, should a breakout occur, its sustainability will depend a lot on if non-commercials give up and cut back their short exposure. For that matter, there is fuel for squeeze elsewhere too.
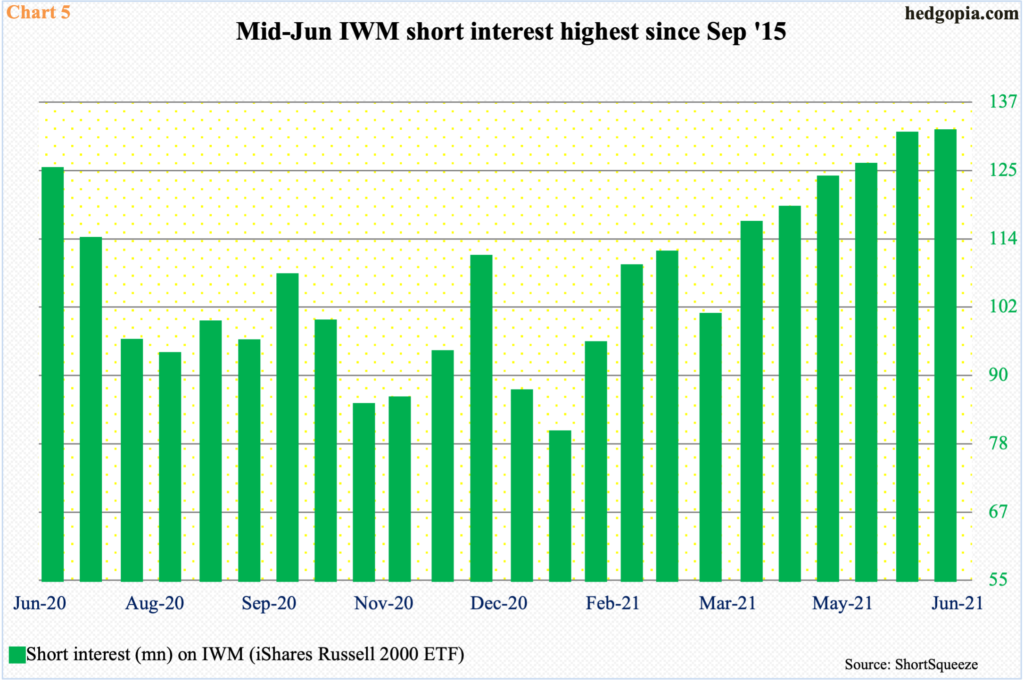
Mid-June, IWM (iShares Russell 2000 ETF) short interest stood at 130.5 million, which was the highest since September 2015.
After bottoming at 78.8 million mid-January, short interest has persistently moved up, rallying in every period the past three months (Chart 5). (Data comes out twice a month.)
With the ETF/Russell 2000 near their highs, shorts are hurting and will be forced to rethink their posture should a decisive breakout occur.
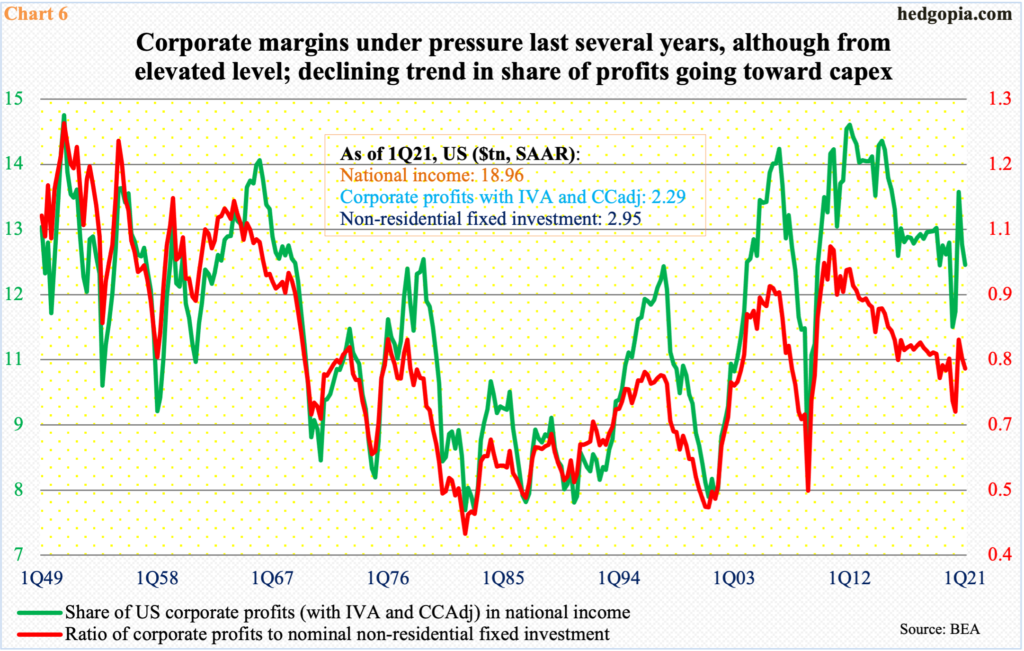
Big picture, equities have managed to perform as well as they have despite corporate margins that have been under pressure for a while now, although from an elevated level.
Chart 6 plots a proxy by calculating a share of corporate profits adjusted for inventory valuation and capital consumption in national income. In 1Q21, they were respectively $2.3 trillion and $19 trillion, resulting in a margin of 12.1 percent. In 1Q12, the green line rose as high as 14.5 percent before going the other way. In 1Q20, it made a low of 11.1 percent.
Companies’ share of profits going toward capital expenditures is similarly under pressure.
In normal times, this would probably matter. But right here and now, investor sentiment is dictated more by Fed policy and by if the extraordinarily loose monetary policy will continue.
The fed funds rate remains zero-bound and the Fed spends up to $120 billion a month in purchases of Treasury notes and bonds ($80 billion) and mortgage-backed securities ($40 billion). As of last Wednesday, the Fed held $8.1 trillion in assets, up from $4.2 trillion in early March last year.
In the wake of a slightly hawkish tilt in the June 15-16 FOMC meeting in which members brought forward their projections for interest rate hikes into 2023, repercussions were felt across assets. The immediate post-meeting reaction was to sell stocks, sell bonds, buy the dollar and sell gold. Stocks recovered as FOMC doves worked hard to convince the markets that they are in control.
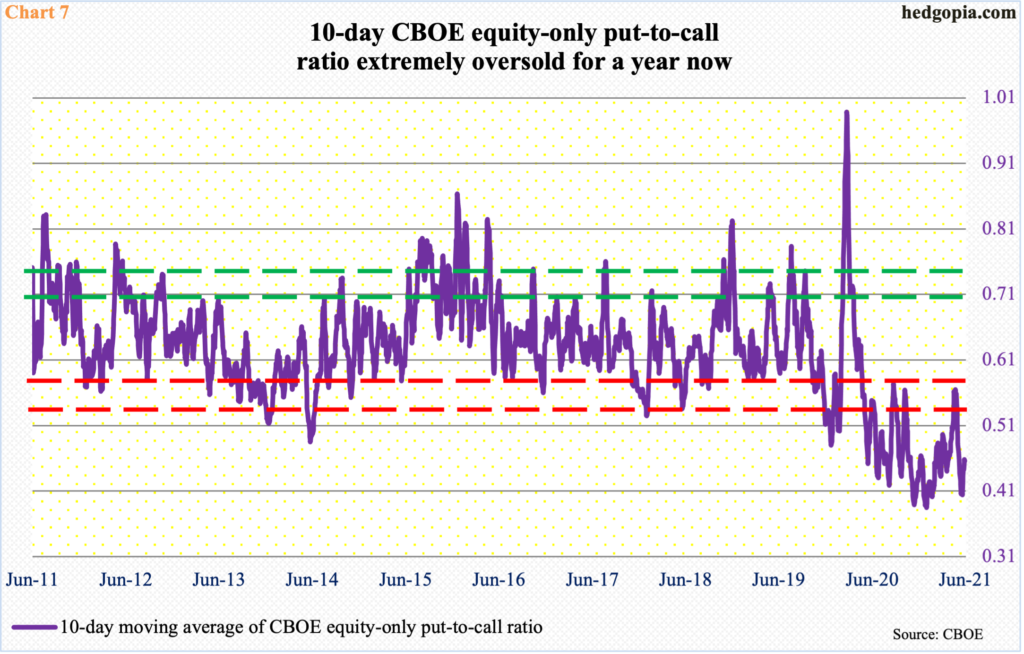
The rather ebullient investor mood is reflected in options, with the 10-day average of the CBOE equity-only put-to-call ratio persistently in 0.40s for a while now (Chart 7). This eventually gets unwound. It always has – either from oversold or overbought territory.
Of late, investors have been paying attention to inflation, which is showing signs of life.
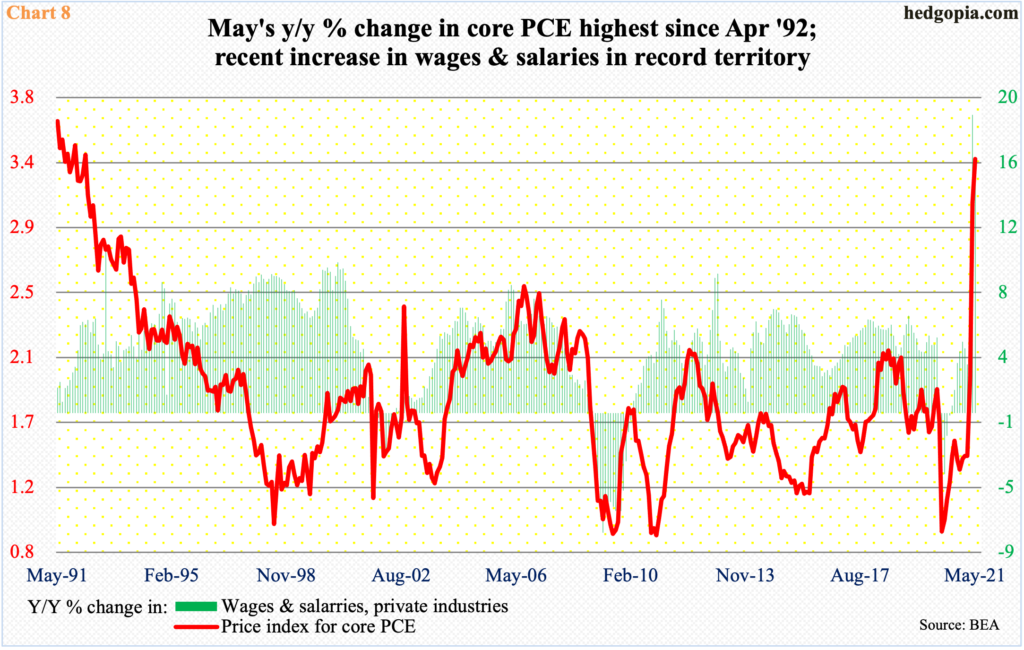
In the 12 months to May, core PCE – the Fed’s favorite measure of consumer inflation – increased 3.4 percent, which was the fastest y/y pace since April 1992 (Chart 8). The overwhelming majority believes the current pace of price appreciation is transitory, including the Fed. Indeed, it is hard to imagine used car prices, for instance, jumping double digits month in month out. But wage inflation can be sticky, so needs watching.
All along the recent spurt in inflation, stocks have looked the other way, buying into the thesis that it is transitory. It is very possible when the news actually hits – that is, inflation begins to recede – a ‘buy the rumor, sell the news’ phenomenon kicks in. It is even possible stocks begin to anticipate this.
Should things evolve this way, immediate support is at 4250s on the S&P 500, 14000 on the Nasdaq 100 and 2280s on the Russell 2000.
Thanks for reading!
