
In the August expiration, the amount of call open interest in VIX heavily outweighs that of puts. Put open interest, represented by the red bars in Chart 1, is decent in near-the-money or slightly-in-the-money strikes, but pale in comparison to the red bars.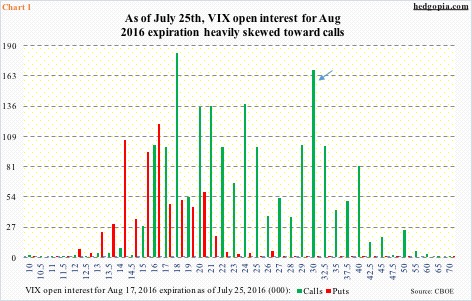
The September expiration looks a little different. There is a sizable amount of put open interest in near-the-money or slightly-in-the-money strikes, although in the aggregate, it still leans call-heavy (Chart 2).
It is hard to tell, but given the amount of call open interest in both August and September, it is possible at least some of the put open interest in near-the-money or slightly-in-the-money strikes is comprised of short puts, which, once again, is a wager that VIX will find floor and/or will rally.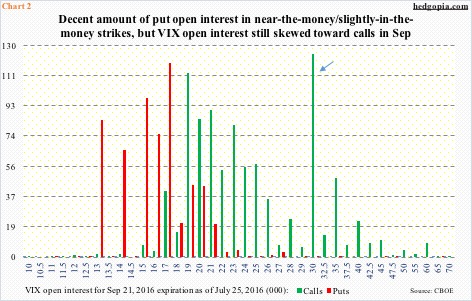
In this scenario, there might be some calendar spreads in the mix as well. In both August and September, calls are heavy in the 30 strike, for example (arrows in Charts 1 and 2).
In a long calendar spread, a short-dated option is sold and a longer-dated option is bought, for a net debit. In this case, the August 30 is sold and the September 30 is bought. The idea being the former will not rally past 30, and hence expire out of the money, leaving the holder with a long position.
But the bigger question is, what are the odds all these calls will end up in the money? The short answer is, pretty good.
First a little primer on VIX.
Most assume that the VIX index is the underlying security for VIX options. In fact, its future contract is. Hence the reason behind possible discrepancy between VIX options and VIX. These two will match – or come close to matching – on the morning of expiration.
Now about those odds.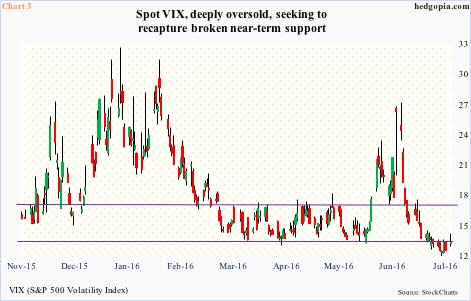
Between the June 27th high of 26.72 and the July 20th low of 11.40, spot VIX shed north of 15 points in just about three weeks (Chart 3). It has stayed under 13 in the past eight sessions, twice under 12. The last time it traded under 12 was in August last year. In fact, back then it briefly went sub-11, right before surging.
VIX is suppressed, both on a daily and weekly chart. The 10-day moving average is no longer dropping, is flattish and itching to curl up. In the next couple of sessions, a bullish MACD cross looks imminent. Yesterday, the spot tried very hard to recapture the broken short-term support, but closed right on it. The upper end of the range in Chart 3 lies at 16-17.
From this perspective, it probably makes sense for the options market to be betting on a rise in volatility in the next several weeks.
Heavy call activity is also supported by steep contango in the volatility curve.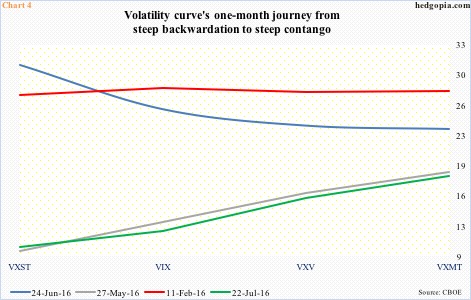
In Chart 4, the blue line is represented by June 24th closing prices in VXST (nine days), VIX (30 days), VXV (three months), and VXMT (six months); the curve was steeper than on February 11th. This has now been completely replaced by steep contango. Markets are expecting higher volatility in the outer months. Bodes well for long calls in Charts 1 and 2.
Thanks for reading!
