
The Russell 2000 closed Friday right at, or slightly past, crucial resistance. If bulls succeed in decisively take out this ceiling, risk-on sentiment can rise. Failure to do so can lead longs, who are sitting on handsome gains, to lock in profit.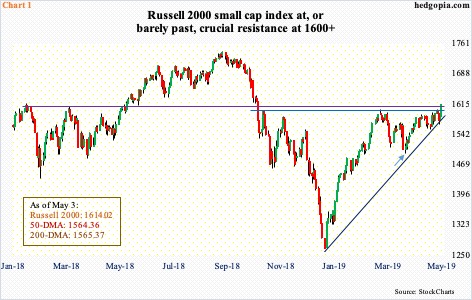
After underperforming their large-cap cousins for weeks, small-cap bulls showed their mettle last week. The Russell 2000 small cap index is still the only major US equity index not to have completed a 50/200 golden cross. A mere 1.01 points separate the two moving averages. A cross is just a matter of time assuming Friday’s two-percent jump is not a one-off. More important is where the index sits currently.
The index bottomed last December at 1266.92. The subsequent rally tagged 1602.10 on February 25 before pulling back. Last Monday, it once again retreated after touching 1603.08. Resistance just north of 1600 goes back to January last year. Friday’s two-percent jump puts the index (1614.02) slightly past or right at this resistance (Chart 1).
This is taking place even as daily Bollinger bands have tightened. A sharp move seems imminent – either up or down. A decisive breakout has the potential to unleash risk-on sentiment – duration notwithstanding. In general, traders tend to gravitate toward small-caps when they are in a mood to take on risk. This is an opportunity for small-cap bulls to build on. At the same time, around 1575 rests a rising trend line from late December. A breakdown can tempt longs into locking in profit. From December lows, the Russell 2000 is up north of 27 percent.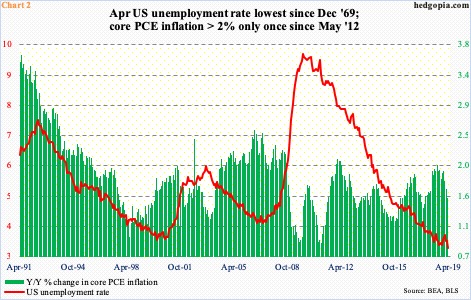
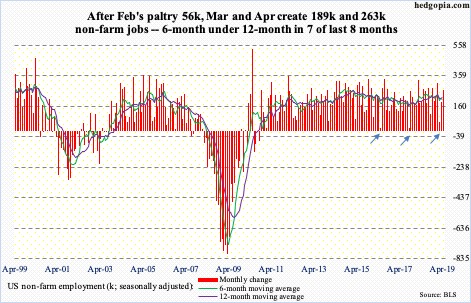
Friday, US stocks rallied big. Small-caps led all of its major peers. April’s jobs report was received well. The economy produced better-than-expected 263,000 non-farm jobs, for a monthly average this year of 205,000. February’s paltry 56,000 increasingly looks like an aberration, not a trend (chart here).
The unemployment rate fell to 3.58 percent in April – the lowest since December 1969. The relatively high number of Americans that have opted out of the labor force contributes to this. In April, 96.2 million were not in the labor force, just a touch below last August’s record high 96.3 million.
That said, the fact remains that the job market has been humming along. Post-Great Recession, 20.1 million jobs have been created. This is yet to put upward pressure on inflation. In the 12 months to March, core PCE – the Fed’s favorite measure of consumer inflation – further softened to 1.55 percent. Last July, it grew 2.04 percent, which was the first two-percent print since April 2012 (Chart 2).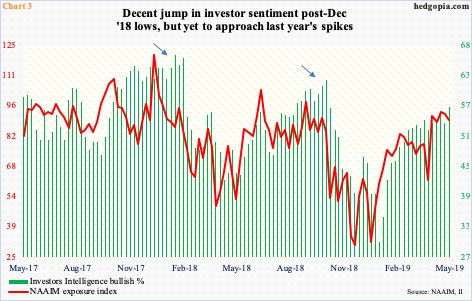
The lack of inflation is one reason why equity bulls believe the Fed is done raising rates. After nine 25-basis-point hikes over three years, the fed funds rate currently stands at a target range of 225 to 250 basis points. The last hike took place last December, when the Fed essentially signaled there would be none this year. Markets quickly reacted. From late-December lows, major indices have all rallied north of 20 percent. The upbeat mood is reflected in investor sentiment.
Last week, Investors Intelligence bulls rose three points week-over-week to 56.4 percent – a 30-week high. For the first time in 29 weeks, the bulls-to-bears ratio crossed three. Concurrently, the NAAIM exposure index, which represents members’ average exposure to US equity markets, dropped 2.6 points w/w to 89.8. The 93.4 reading two weeks ago was the highest since late August last year (Chart 3).
Nonetheless, both these measures of sentiment – one survey-based and the other involving real money – are below the spikes of last year, which preceded peaks in stocks. Hence bulls’ optimism that sentiment will continue to firm up in the weeks ahead. This is also the reason why how small-caps behave can play a role. In the right circumstances for bulls, all this could reverberate through Chart 4.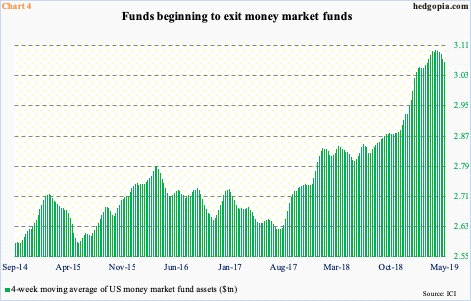
There is a lot of money sitting idle in US money market funds. From early October last year, when stocks began to sell off, through early March, they grew by $242.1 billion to $3.11 trillion. Rather interestingly, money continued to flow into these funds even after stocks began to rise late December. It is only since the March high that they have come under pressure. Last week’s tally was $3.07 trillion (courtesy of ICI).
Chart 4 uses a four-week average, and the downward trend the last several weeks is evident. Bulls obviously hope this is the beginning of a trend and that, as money leaves these funds, equities attract their fair share.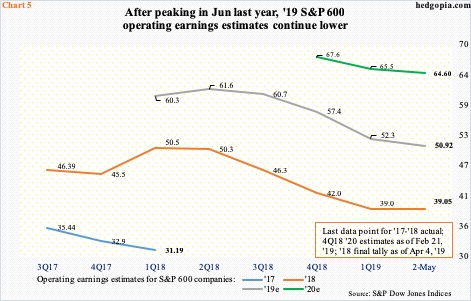
If this scenario pans out, longs would increasingly be buying at higher multiples. The S&P 600 small cap index currently has an operating P/E of 19.4x on ’19 earnings and 15.3x on ’20. It is impossible to trust next year’s estimates. Just look at the revision trend in Chart 5.
In March last year, ’18 estimates stood at $50.66; when it was all said and done, these companies earned $39.05. This year’s revision trend is no different. Last June, ’19 estimates were $61.63, which by last Thursday were revised downward to $50.92. The sell-side is notorious for starting out optimistic and then bring the knife out as the year progresses. For next year, these analysts have penciled in $64.60, down from $67.63 in February but elevated all the same.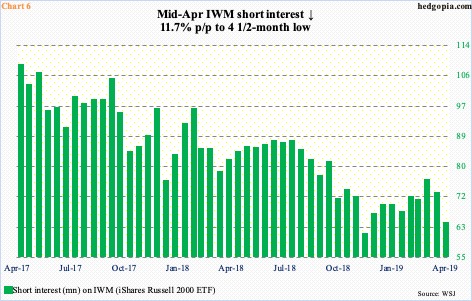
The extended multiples are more of a medium- to long-term issue. Near term, momentum likely plays the deciding role, which bulls currently enjoy. Once again, how the Russell 2000 behaves in the sessions/weeks ahead can impact overall sentiment. Enter short interest on IWM (iShares Russell 2000 ETF).
For a while now, IWM short interest has trended lower. Most recently, in the month ended mid-April, it dropped 15.8 percent to a four-and-a-half-month low. Shorts covered/got squeezed as the ETF began rallying from March 25 (arrow in Chart 1). At 64.1 million, short interest remains high. Squeeze can still take place. But the fact remains that it is at a multi-year low.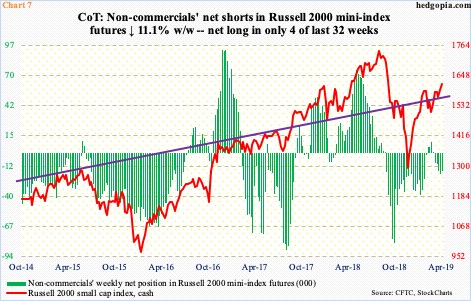
There is a similar phenomenon taking place in the futures market. Non-commercials remain cautious.
In the last 32 weeks, they have remained net long Russell 2000 mini-index futures in only four. For the most part, they bet on the wrong horse.
In the latest week, net shorts fell 11.1 percent w/w to 16.8k contracts. If these traders continue to cover – and even go net long – small-caps can potentially get a tailwind. This is a ‘woulda, coulda, shoulda’, but its possibility cannot be brushed off. Hence the significance of if the cash is able to decisively take out 1600-plus. A self-fulfilling prophecy can unleash animal spirits – no matter how short-lived. Just in case this scenario unfolds, a call backspread makes sense.
June 7th IWM 159.50/164.50 call backspread:
- Short one ITM 159.50 call at $3.87
- Long two OTM 164.50 at $1.35 each
A call ratio backspread is a bullish option strategy, deployed if the option trader believes there is significant upside potential. Risk is limited, profit potential unlimited. The hypothetical trade generates $1.17 in credit, which is kept if the ETF ($160.53) fails to rally and closes under $159.50 by expiration. If it rallies, because of the credit taken, it starts making money from $163.33 onwards. That is 1.7 percent from Friday’s close. If IWM closes between the strikes, the short call will end up in the money while the long call will expire worthless, and up to $3.83 will be at risk, with the trade beginning to bleed from $160.67.
Thanks for reading!
