The following are futures positions of non-commercials as of June 23, 2015. Change is week-over-week.
10-year note: Yields pushed up nearly 21 basis points for the week. Sales of both new and existing homes did well in May (even though market reaction was lukewarm). Of the other major data out this week, none was hit out of the park. With a fresh golden cross, the 10-year yield has momentum, and needs to break 2.5 percent for further momentum. Near-term, it is right underneath the upper Bollinger Band (daily) – always a good place to pause.
The jump in 10-year yields was also interesting given Fed Governor Jerome Powell’s comment on Tuesday that a September rate hike is now 50/50. He is a voting member. All seven governors are voting members of the FOMC. “The Fed would like to test a rate rise as soon as September.” Is that hawkish or dovish? The consensus is forecasting 0.58 percent Fed Funds rate by December. Versus this, Mr. Powell’s comments are probably dovish.
Markets did not think so, however. It will probably take a few more similar comments from Fed officials before bond vigilantes realize that a September hike is not a slam dunk. Should this come to pass, there is dry powder to get into bonds. Apparently bond funds are holding about eight percent of their assets in cash-like securities – the highest since at least 1999 (courtesy of FTN Financial, citing ICI data).
Non-commercials continue to cut back on net shorts – down 74 percent just in the last seven weeks. They are cashing in. Since April, TLT, the iShares 20+ Year Treasury Bond Fund, is down nearly 13 percent.
Currently net short 46.7k, down 49.7k.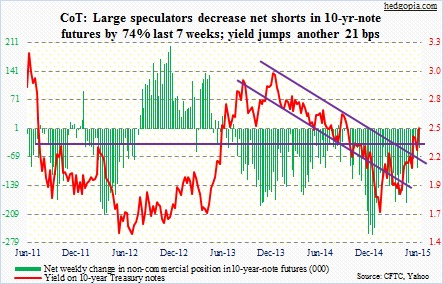
30-year bond: Next week’s major economic releases are as follows.
May’s Pending Home Sales Index, which measures housing contract activity, is set for Monday. The 112.4 reading in April was the highest since 112.5 in May 2006. Year-over-year, the index has risen for eight consecutive months, after 11 consecutive declines before that. Month-over-month, it has risen for four straight months – jibes with recent momentum in sales of both new and existing homes.
Tuesday, we will find out how the S&P/Case Shiller U.S. Home Price Index performed in the month of April. In March, it rose 4.1 percent year-over-year; nationally, price appreciation has been decelerating since 10.9 percent in October 2013. The index, 168 in March, is still below the bubble peak of 184.6 in July 2006. This is slightly different from what we observe elsewhere. The median price of a new home has surpassed the bubble high – November 2014 high of $302,700 well past $262,600 in March 2007; last month was $282,800. On the existing side, May was $228,700, a stone’s throw away from the high of $230,400 in July 2006.
ISM Manufacturing for June comes out on Wednesday. May was 52.8, versus 58.1 last August. New orders rose from 51.8 in March to 55.8 in May, but were down from 63.9 last August. This needs to regain momentum if we are to have a strong second half.
The employment report for June is published on Thursday, as markets are closed on Friday. After March’s subdued 119,000 non-farm jobs, April and May picked up the pace – up 221,000 and 280,000 respectively. Will another good month force the Fed into hiking later this year, as they have been hinting all along? Or would they instead focus on stagnant average hourly earnings? Annual growth in hourly earnings for private employees is yet to exceed 2.6 percent in the current recovery.
Also Thursday, factory orders for May come out. The advance report on durable goods for May was published this week. So next week’s release will contain revised and more detailed estimates, including non-durables. May orders for non-defense capital goods ex-aircraft were $68.6 billion, well below the September 2014 peak of $74 billion. In each of the four months through May, orders have fallen annually, even though the pace of decline has been moderating.
There is just one Fed official scheduled to speak, similar to this week. Last week, there were three.
The momentum in 30-year yields continues – up another 19 basis points for the week.
Currently net long 14.6k, up 3.6k.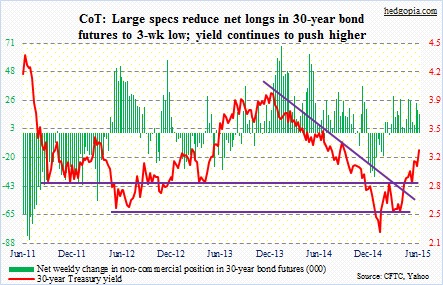
Crude oil: The count is now 13. That is the number of sessions the spot West Texas Intermediate crude has been rejected at 61-62 since May. This week, the WTI tried to take that resistance out on both Tuesday and Wednesday, and failed. As this range-bound action has gone on for two months, the Bollinger Band is narrowing. A rather sharp move may soon be upon us.
Next week is the deadline (June 30) as relates to negotiations with Iran. An agreement has the potential to put one million barrels of crude back on the market – eventually. With that said, odds favor the parties continue to talk past the deadline. If the talks break down – possible but not probable – oil can rally sharply.
Barring that, the 61-62 resistance should continue to hold on the WTI. The 50-day moving average, which was tested on Friday, is a stone’s throw away. Shorter-term moving averages are flat to slightly down, and daily momentum indicators seem to be itching to go lower. This is near-term. Medium-term, conditions are overbought as well.
The thing is, of late the WTI has not been able to rally on positive data points. Back in March when it was hammering out a bottom, it consistently ignored bad news. Now it is the opposite. For the week ended June 19, crude oil inventory dropped another 4.9 million barrels, to 463 million barrels. Inventory peaked at 490.9 million barrels in the April 24 week. With that said, the progress is spotty. Gasoline stockpile jumped 680,000 barrels in the June 19 week. Either supply is rising or demand is falling.
Non-commercials continue to be optimistic.
Currently net long 347.9k, down 12.8k.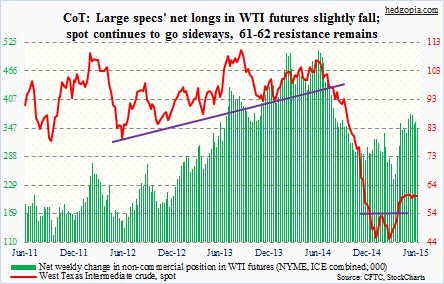
E-mini S&P 500: The bar keeps getting lowered. This week (as of 25th), second-quarter operating earnings estimates for S&P 500 companies were cut by another nickel to $28.46 from last week (courtesy of S&P); last year, earnings were $29.34. For 2015, estimates were cut by 16 more cents, to $115.64 (besides Q2 cut, seven cents came from 3Q, which was revised lower to $29.83, and four cents from 4Q, which now stands at $31.55.
How earnings come in versus consensus estimates is always of importance, but maybe more so now given the amount of short interest on SPY, the SPDR S&P 500 ETF. Since the end of March through mid-June, shorts have persistently gotten aggressive, raising short interest by 33 percent. On the one hand, this reflects conviction on their part, on the other this could be a recipe for squeeze if bulls play their hands right. By the way, NYSE short interest is the highest since end-September 2008.
Looking at how non-commercials are positioning themselves, they seem to be in agreement with SPY/NYSE shorts. Net shorts, which have more or less gone sideways the past three weeks, are near mid-March highs.
Currently net short 92.2k, up 8.1k.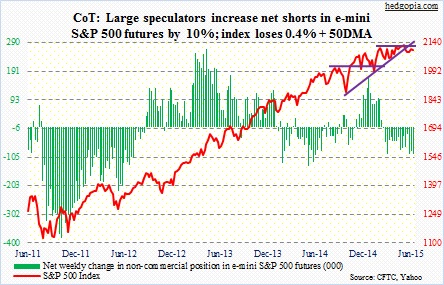
Euro: The currency came under some pressure. Is the euro merely unwinding overbought technical conditions or is genuinely beginning to worry about Greece?
For that matter, is Greece a headline risk or a financial risk?
As of March, Greece’s outstanding debt was €312.7 billion. Of this, €231.2 billion was in the form of loans, with €205 billion belonging to the institutions, which include the IMF, the eurozone’s European Financial Stability Facility and bilateral loans from eurozone countries (courtesy of Danske Bank). From this perspective, the private sector indeed has lesser exposure than in the past. And this is probably why markets are sanguine about Greece.
But in the event the Greek public rejects the bailout deal in the July 5th referendum, there is no way to find out how things will unfold. There is no precedent.
Non-commercials raised net shorts by 11 percent, but are substantially below end-March highs.
Currently net short 99.3k, up 9.9k.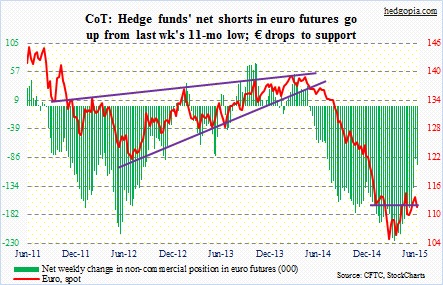
Gold: On Thursday last week, the metal was rejected at its 200-day moving average, and has been all downhill since. For gold bugs, the good thing is, it is currently near the lower Bollinger Band. Friday also produced a doji.
Simplistically, the bubble in Chinese stocks probably is not helping gold. Why invest in something that does not earn interest and has ceased to appreciate? People don’t think of gold when they are obsessed with stocks and margin borrowing. Similarly in India, another crucial market for the metal, the monsoon season plays an important role. Timely rains mean crops stay in good shape, which will then enhance farmers’ disposable income. Diwali, as well as the wedding season, falls in the second half. Something to watch.
Non-commercials raised net longs by 26 percent, even though holdings have been cut in half from late-January highs.
Currently net long 95.1k, up 19.4k.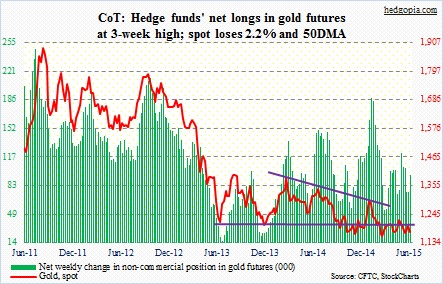
Nasdaq 100 index (mini): It is clinging on to support at 4480 and near its 50-day moving average. Downward pressure is building right at this moment.
Wednesday, the 21-day moving average of the CBOE equity put-to-call ratio was 0.598. This was the first sub-0.6 reading since 12/8/2014. Back then, beginning November 24th, the ratio stayed in the high 0.50s for 10 straight sessions, before rising. Stocks soon came under pressure, as the Nasdaq 100 went on to quickly lose four-plus percent. This time around, after Wednesday, both Thursday and Friday rose to the low 0.60s. More often than not, it has paid to be cautious near-term when the ratio has dropped this low.
Non-commercials beg to disagree, raising net longs to an eight-week high.
Currently net long 74.7k, up 22.1k.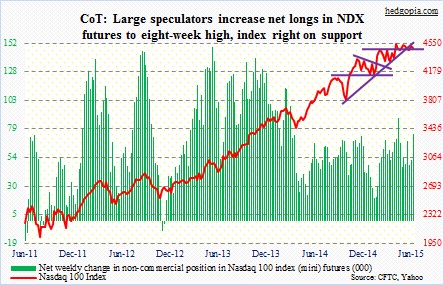
Russell 2000 mini-index: Last week’s breakout probably did it. The former non-believers have thrown in the towel. Non-commercials are now net long. This has been a long time coming – 15 months to be exact.
That breakout was already tested on Friday – successfully. It was the first test, so was not supposed to buckle under pressure at the very first try. More tests probably lie ahead. RVX, the Russell 2000 Volatility Index, needs to cooperate if the bears are to win out. The key is what happens when it approaches 18 and change, which has provided stiff resistance for a while now.
Currently net long 10.2k, up 13k.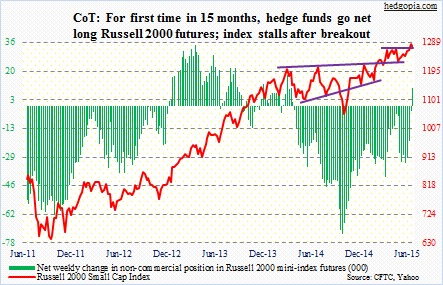
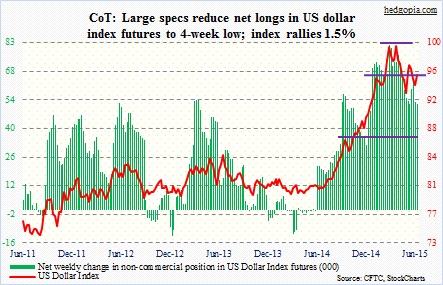
U.S. Dollar Index: It rallied 1.5 percent for the week. All of that gain came on Monday and Tuesday. Yet, that was not enough to excite non-commercials into adding to net longs. In fact, they trimmed their holdings by two percent.
Interesting tidbit: Total foreign exchange reserves in emerging countries are estimated to have declined $222 billion to $7.5 trillion in the first quarter (as per WSJ). Apparently, central banks in these countries are running down FX reserves at the fastest pace since the financial crisis. Reason why Christine Lagarde, IMF managing director, is worried about a tighter monetary policy in the U.S.?
Currently net long 52.3k, down 1.1k.
VIX: Spot VIX rose to 14.91 Friday before backing off. Volatility continues to get sold off at/near 15. This has been going on since April. Non-commercials continue to have sizable net shorts, but they have also been cutting back. Off early-May highs, net shorts are down 31 percent. Signal or noise?
Currently net short 52.3k, down 17.4k.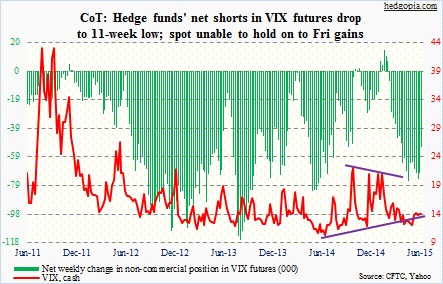
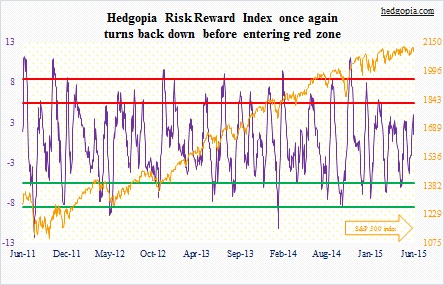
Hedgopia Risk Reward Index