The following are futures positions of non-commercials as of March 17, 2015. Change is week-over-week.
10-year note: What a week! In four out of the five sessions, the 10-year yield fell – down 18 basis points for the week. On Wednesday alone, it fell 11bps. The bond market heard the Fed loud and clear that day. The mid-point of FOMC’s 2015 real GDP growth forecast dropped 0.3 percentage point to 2.5 percent. All in all, the message was clear: Things have shifted down. These traders have stubbornly stayed net short, and it is a sizable position. They cut back some in the week. It is possible they have cut back more, as their positions do not reflect Wednesday’s trades.
The yield currently sits right on the lower end of a one-and-a-half-year channel. Daily technicals are getting oversold, but there is plenty of room for weeklies to go lower. In all likelihood, that support gives way. Currently net short 107.5k, down 30.7k w/w.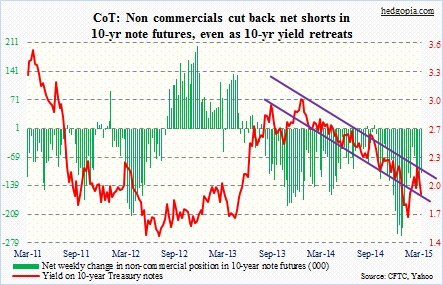
30-year bond: They added during the period, taking net longs to a 16-week high, and have been proven right. Yields fell 19bps in the week. As is the case with the 10-year, the path of least resistance for 30-year yields seem down at the moment. Several weekly momentum indicators have already curled down from the middle of the range. The 50-day moving average has already been lost, and needs to be recaptured soon if these yields were to head higher. The 2.5 support has not been lost. In fact, the 30-year is sitting right on it. Bondholders have to start selling aggressively right here in order to save that support – not a base case. TLT has rallied to trade above its 50DMA, with shorter-term moving averages curling up. Currently net long 29k, up 22.4k.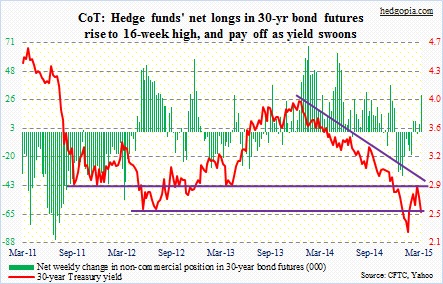
Crude oil: Price action has improved. On January 29, the West Texas Intermediate crude made an intra-day low of 43.58. This Tuesday, it made another low, at 42.41. Several momentum indicators in the meantime posted higher lows, which is always a good thing. On Wednesday, the WTI surged 10-plus percent, reacting to the sell-off in the dollar, which was reacting to what came out of the FOMC meeting. Commodities are priced in dollars, hence the buck’s significance. As far as weekly inventory/production data are concerned, the trend continues to be up. Demand for crude tends to slow down in the spring time – more reason for inventory buildup. Yes, rig counts are down. But they have not had much impact on production. The cost to operate the infrastructure already in the ground (or water) is substantially less than the initial investment (sunk cost). This encourages operators to continue operating.
In the end, it all boils down to storage capacity. Genscape points out that Cushing, OK, is 78 percent full. So yes, the decline in the dollar has helped, but more important perhaps in the next several weeks is the dynamics between production and storage. Currently net long 271.5, down 14.2k.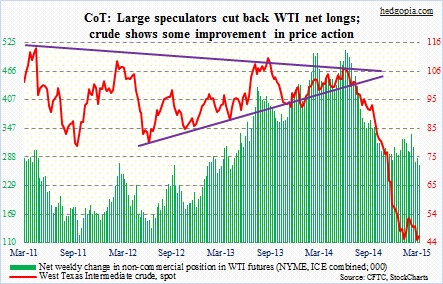
E-mini S&P 500: Since the Fed instituted QE back in the latter months of 2008, the central bank has longed for higher stock prices.
Defending the Fed’s extraordinary measures including QE, in an 11/4/2010 Washington Post op-ed piece, Chairman Ben Bernanke wrote “stock prices rose…” Talking to Bloomberg on 10/16/2014 in the midst of a sell-off in stocks, James Bullard, St. Louis Fed president, said inflation expectations were declining, hence “a logical policy response at this juncture may be to delay the end of the QE.” He also suggested QE4 was possible. And on July 15, 2014, in her Humphrey-Hawkins testimony, Chair Janet Yellen pointed out that “valuation metrics in some sectors do appear substantially stretched – particularly those for smaller firms in the social media and biotechnology industries.” Biotech stocks since have moved substantially higher. In the post-FOMC press meet this week, she was asked what she thought of these stocks now. She chose not to comment.
The message in all this is that the Fed does not want to rock the stock-market boat. At least that is how market participants have perceived the latest FOMC statement. From Tuesday close, the S&P 500 has added 1.6 percent. The perception is that the Fed has done a 180 – even 360 to some – as far as its willingness to hike is concerned.
In the past, this blog has argued that the odds of a rate hike in June – or even later this year – are next to nil. The post-FOMC reaction across asset classes suggests markets are beginning to price that in. How else do we explain the move in stocks (↑) as well as the dollar (↓)?
As early as Monday, bulls had managed to conquer the 2064 resistance on the S&P 500. In the hours leading up to 2 o’clock on Wednesday, that level was tested again – successfully. Once the statement came out, there was no looking back. Hello, risk-on!
Is it healthy long-term? Hell, no. Are we digging ourselves into a deeper hole? No doubt. This snippet came from Bespoke: 56 of the 89 stocks in the Nasdaq Biotech Index with market caps of more than $1 billion have no earnings. Imagine that. Where have we seen this before? 1999/2000, anyone? Chair Yellen is right to worry about these stocks, but the Fed cannot have it both ways. You cannot wish to benefit from the wealth effect and not want to see higher stock prices at the same time.
So stocks rally. And there is room for it to run. Run a lot if bulls are able to squeeze a heck out of shorts. Short interest remains elevated.
In seven sessions, 1Q comes to a close. End-of-quarter shenanigans are possible. Shortly thereafter, the 1Q earnings season gets underway. Operating earnings for S&P 500 companies are expected to drop 1.7 percent year-over-year. As early as end-2014, they were expected to grow 12 percent! While in a normal environment, this would have probably taken stocks to the woodshed, but these are not normal times. The Fed put is alive and well. And the earnings bar is now substantially lower to jump over.
In the meantime, net shorts went up 78 percent in the period. This is the highest it has been in nine months – a possible recipe for squeeze. Currently net short 93.9k, up 41k.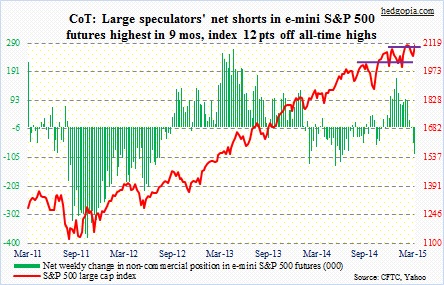
Euro: Another asset class to benefit from the FOMC statement! On Wednesday, the euro jumped 2.6 percent, even though the low was put in last Friday. These traders did add to their net shorts during the reporting period. Nonetheless, it is possible they were forced to cover post-FOMC. There has been a surge in interest to go long the currency. Weekly volume on FXE was the highest since October 2011. In the short-term, there is room for it to rally to 110 (112 on the euro). More interesting would be if the massive euro short positions are forced to cover. Currently net short 193.8k, up 181.1k.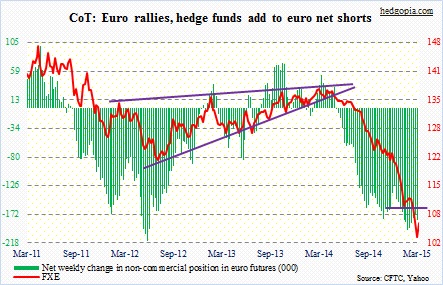
Gold: Gold bugs putting the foot down? This is as good a spot as any for them to do so. The metal is literally sitting at 1,180, which for a long time had acted as support. By the way, the chart uses closing price, so the support line is drawn around 1,200. The dollar has helped. As well as a dovish Fed. If gold cannot rally now, then one wonders when. Non-commercials in the meantime have continued to cut back. But this was before Wednesday. So how they position next week will be a good tell. Currently net long 53.1k, down 28.8k.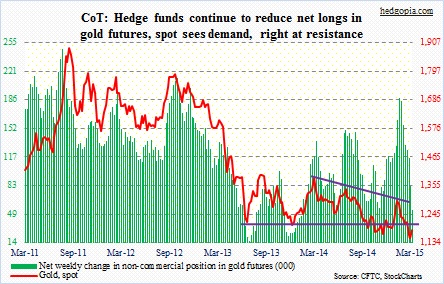
Nasdaq 100 index (mini): Turns out, these traders were stubborn as well as prescient. The index added 3.3 percent this week. In the prior three weeks, it was down each week, with non-commercials adding to net longs each week. This week, they got vindicated. The index posted a new monthly closing high. Biotechs have been a big help, and they have been on an unsustainable tear. AAPL is another concern; continues to act poor. It was down Friday. Currently net long 57.5k, down 11.9k.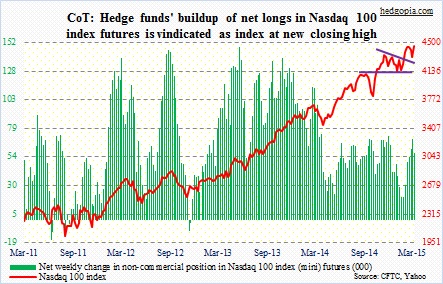
Russell 2000 mini-index: It was a classic breakout retest. As seen in the chart, the somewhat tentative breakout pulls back to test support, and then shoots higher. As if they saw what was coming, non-commercials reduced net shorts by 35 percent in the reporting period. It is counterintuitive for small-caps to be rallying if the economy is slowing down, evidenced by the new FOMC GDP forecast. On the other hand, they don’t have to be suffering from the dollar woes as multinationals would. Whatever it is, money seems to gravitate toward them at present. This is happening even as RVX, the CBOE volatility index for RUT, closed at 15 this week. This data series only goes back to May 2006. The lowest point (13.62) was reached in March 2013, but 14-15 has been solid support. Currently net short 26.3k, down 14.4k.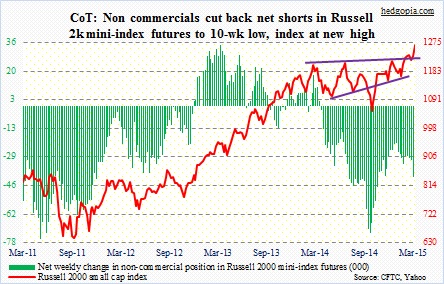
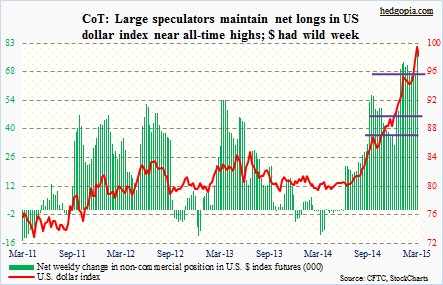
U.S. Dollar Index: This could prove to be an important week for the dollar. It was a highly volatile week – high of 100.71 and low of 94.76. The 61.8-percent Fibonacci retracement of the July 2001-April 2008 decline lies at 102.2, not too far away from this week’s high. This is always a good level for a trend to pause/reverse. Unless a miracle happens and macro data points begin to firm up in the weeks/months to come – not a base case – the ‘higher interest rate around the corner’ thesis has lost grounds. The interest-rate differential still favors the dollar. But will the latter be enough for these non-commercials to continue with their massive net longs? Especially when puts are beginning to build up on UUP. Currently net long 79.7k, down 1.5k.
VIX: Once again, these traders have been vindicated. In a month, their exposure has gone from plus 7k to minus 36k. Spot VIX was down nearly 19 percent for the week, and is sitting on trendline support, going back to June last year. It likely loses that. Weekly technicals in particular have room to come under pressure. Currently net short 35.9k, up 3.5k.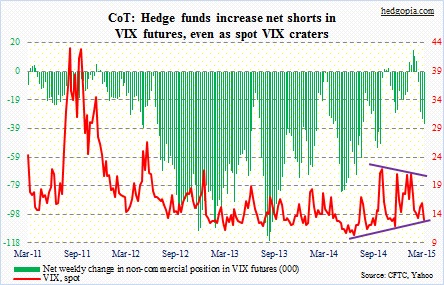
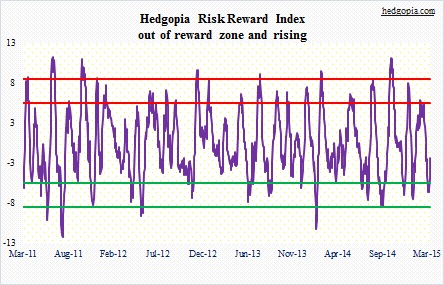
Hedgopia Risk Reward Index