
US stocks rallied strongly last week. Bulls enjoy momentum right now. That said, risk-on is not full-on. What transpires at 2890s on the S&P 500 can be a tell near term.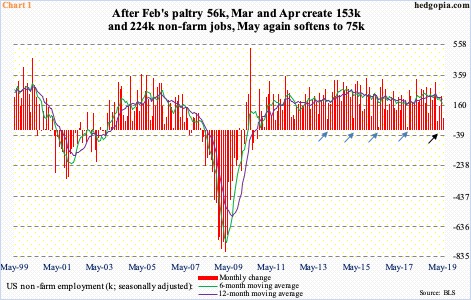
May’s employment report was mixed at best and disappointing at worst. The unemployment rate inched up to 3.62 percent; April’s 3.58 percent was the lowest since December 1969. Private-sector wages rose 3.1 percent year-over-year to $27.83. This was the 10th consecutive month in which wages grew at three percent or higher (last September was 2.98 percent, to be precise). That said, wage growth has softened progressively from February’s 3.40 percent pace. Before last August’s 3.18 percent, the last time average hourly earnings grew with a three handle was in April 2009.
Above all, job creation was a dud. Only 75,000 non-farm jobs were added in May, for a monthly average this year of 164,000, versus 223,000 last year. The pace has softened. May was the second sub-100,000 month this year, with February having created 56,000 jobs (black arrow in Chart 1). Several times in the past in the current cycle, there have been one-month anomalies but only to shoot right back up in the subsequent months – 67,000 in December 2013, 77,000 in March 2015, 15,000 in May 2016 and 18,000 in September 2017 (blue arrows). This time around, the weakness is persisting.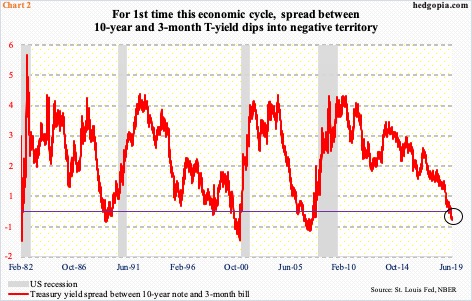
It increasingly feels like the bond market had it right all along. The 10-year Treasury yield (2.08 percent) peaked as far back as early October last year at 3.25 percent. In the subsequent months, it lost one after another support, including 2.62 percent, which goes back a decade, followed by 2.36 percent a little over two weeks ago.
Last Friday’s intraday low of 2.05 percent came pretty close to testing the September 2017 low of 2.03 percent. The daily is trying to stabilize. Given the 37-basis-point drop last month, sideways action will help, so shorter-term averages begin to at least flatten out.
More importantly, as the long end began dropping sharper than the short end, the yield curve began to contract. Markets closely watch the spread between 10-year notes and three-month bills. For the first time since 2007, it dipped into negative territory on March 22, and has alternated between positive and negative since, with inversion the last 11 sessions.
As Chart 2 shows, when it comes to the economy, yield-curve inversion does not bring back happy memories. In a CNBC interview last Tuesday, Richard Clarida, Fed vice chair, said that “… if the yield curve inverts as it has … and if it persists for some time, that is obviously something I would definitely take seriously.” As things stand, this is as dovish as he could get. Also last week, Chair Jerome Powell indicated the Fed would respond should the economy need help.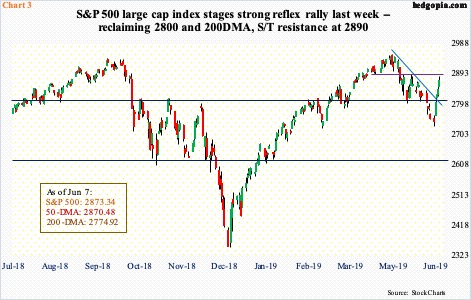
Enter May’s jobs report. Ordinarily, there was not much in that report to cheer about. Yet, stocks rallied big Friday. The S&P 500 large cap index (2873.34) jumped 1.1 percent (Chart 3). The much-weaker-than-expected report all but convinced markets that it was only a matter of time before the Fed eased. Last December, the bank took the fed funds rate to a range of 225 to 250 basis points – ninth 25-basis-point hike since December 2015 – and has gone on the sidelines since.
As things stand, the next move in all probability is down, it is just a matter of magnitude and duration. Currently, fed funds futures have priced in a 25-basis-point cut in July, then another in October, with September and December toss-ups.
Hence Friday’s risk-on sentiment. In fact, stocks had a pretty good week last week. The S&P 500 jumped 4.4 percent, reclaiming both the 200-day moving average and 2800. It pretty much closed on the 50-day, with short-term resistance at 2890s.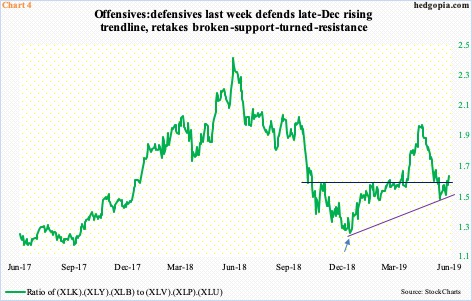
But how genuine is this risk-on feeling?
Chart 4 uses six SPDR sector ETFs to create a ratio between offensives and defensives. XLK (technology), XLY (consumer discretionary) and XLB (materials) are treated as offensives and XLV (health care), XLP (consumer staples) and XLU (utilities) as defensives.
Stocks in general peaked as soon as May began. This was led by offensive sectors. The ratio peaked on April 23 at 1.924. Then on May 23, it bottomed at 1.435, followed by a higher low of 1.459 on June 3. This made sure a rising trend line from last December was successfully defended. Friday’s rally also took care of eight-month, broken-support-turned-resistance (Chart 4).
So far so good. This feel-good story is not devoid of holes, however.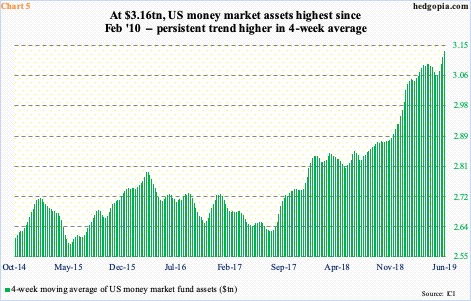
Flows are not in cooperation. In the week to last Wednesday, $12.2 billion left US-based equity funds. This followed outflows of $22 billion in the prior week (courtesy of Lipper). Remarkably, since stocks bottomed last December, these funds have lost $88.1 billion!
Money-market assets are the same way. In the week through last Wednesday, another $14.3 billion went into these funds, for a total of $3.16 trillion. This is the highest total since February 2010. Once again, since stocks bottomed last December, money markets have attracted $123.8 billion (courtesy of ICI). This is not normal. Post-December bottom, stocks rallied massively, and this ordinarily should have attracted funds parked in money markets. Not so. The four-week moving average continues higher (Chart 5). These parked dollars are not ready to jump on the risk-on bandwagon.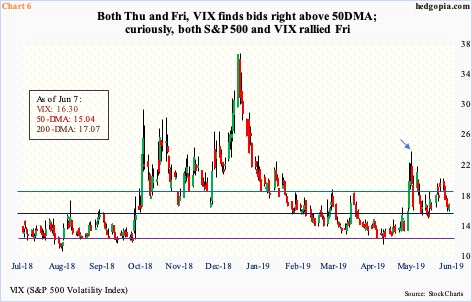
Or take VIX for that matter. Last Friday, along with stocks, VIX (16.30) rallied 2.3 percent. This is rare – both stocks and volatility moving in tandem. The low in that session was 15.33, just above the 50-day. On Thursday, too, the average was defended.
Since rallying to 23.38 on May 9 (arrow in Chart 6), VIX has made lower highs. Last Monday’s intraday high of 19.75 was all it could manage since bottoming at 14.42 10 sessions ago. Even back then, VIX rose after tagging the 50-day.
So, despite the fact that after the Boxing Day low the S&P 500 went on to post a new high on May 1, VIX has remained at a higher plateau. It has not breached 11. From stocks’ perspective, it is risk-on all right, but it is blended with caution.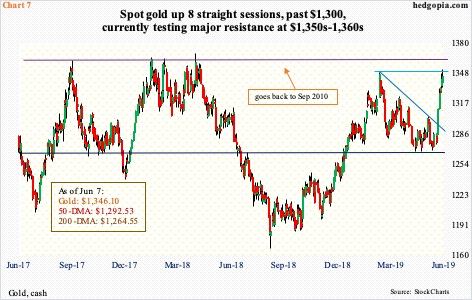
This is also reflected in how gold is acting. The metal has rallied for eight straight sessions. In the week to Wednesday, GLD (SPDR gold ETF) took in $694 million, and $315 million in the couple of weeks before that (courtesy of ETF.com). As of last Tuesday, non-commercials took their holdings to 156,115 net longs in gold futures, up 69,427 contracts week-over-week – the highest since April last year.
The yellow metal traditionally is a safe-haven asset. Yes, before the latest rally began, it was oversold, but the sudden interest even as stocks are rallying is curious. For a month through May 21, gold ($1,346.10) tested support at $1,260s – successfully (Chart 7). The rally that followed has not only unwound its oversold condition but also brought it right at/underneath major resistance at $1,350s-1,360s, which goes back to September 2010. A breakout right here and now would not be easy. The daily is beginning to look extended. But once one occurs, it would have sent a massive risk-off signal.
For now, even though several risk-on metrics have not all fallen in line, equity bulls possess the ball. After a big rally last week, what transpires at 2890s this week will be a tell as to where things might be headed near term (Chart 3).
Thanks for reading!
