
After a 13-session, heady rally off June 27th lows, U.S. stocks are beginning to reek of complacency. The question is, is it now time to turn contrarian or things might stay complacent for a little while longer?
Take put-to-call ratios.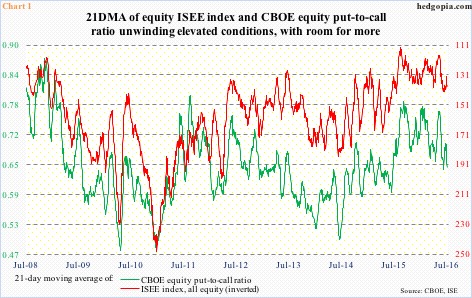
Through last Friday, the CBOE P2C ratio dropped and stayed in the 0.50s for six consecutive sessions. This is not a normal occurrence. The last time this took place was in February last year. In the past 13 sessions, the ratio has been in the 0.50s nine times. The 21-day moving average, under pressure since July 6th, last Friday nearly matched the June 21st low (Chart 1).
Along the same lines, the 21-day moving average of the ISEE, all equity, call-to-put ratio (hence inverted in Chart 1) has been once again rising in the past three sessions.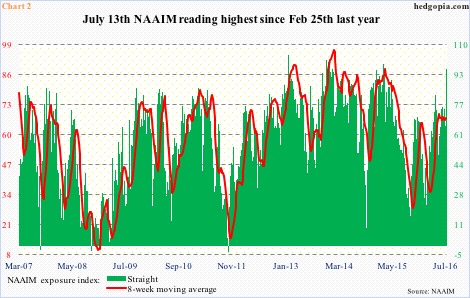
There is a variety of surveys geared toward measuring investor sentiment, such as Investors Intelligence, American Association of Individual Investors, Market Vane, etc. The National Association of Active Investment Managers (NAAIM) puts out a weekly survey showing members’ exposure to U.S. stocks. Unlike purely opinion-based surveys, this one involves real money.
In the latest week, the NAAIM exposure index shot up 31.09 (no typo) week-over-week to 96.52. This was the largest w/w increase since the week ended October 22, 2014. Back then it rose from 9.97 to 41.38 – obviously from extremely suppressed level to just about the median. This time around, it rose from 65.43 – from already elevated to now extremely elevated.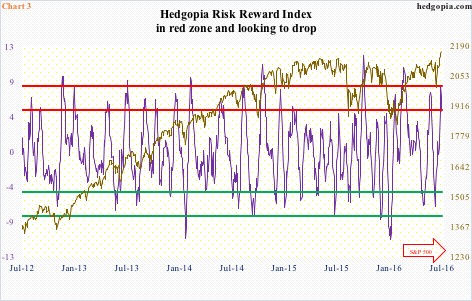
Our own Hedgopia Risk Reward Index entered the red zone on Tuesday last week, before beginning to come under pressure and closing Friday at just under five (Chart 3). Should it continue to unwind overbought conditions and head lower, and if past is prologue, that should put stocks under pressure.
Stocks in general enjoyed a massive rally in a very short span of time, which explains why the afore-mentioned metrics have quickly moved into overbought/complacent territory in the first place.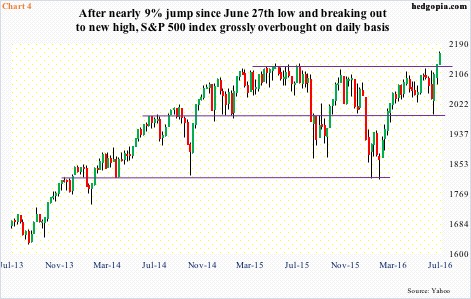
Accordingly, both the S&P 500 large cap index and the Dow Industrials have broken out to new highs. The S&P 500 (2161.74) in particular has rallied nearly 20 percent since February lows. Post-Brexit, it shed 5.3 percent in two sessions, but off the June 27th low has rallied nearly nine percent … in 13 sessions! In doing so, the index broke out of months-long sideways move, which can be traced back to March last year (Chart 4).
Inflows have started cooperating … finally.
In the week to Wednesday last week, $8.3 billion moved into SPY, the SPDR S&P 500 ETF. In the prior week, $4.6 billion came in (courtesy of ETF.com). Similarly, for the first time in 11 weeks, U.S.-based equity funds attracted funds – $7.8 billion (courtesy of Lipper).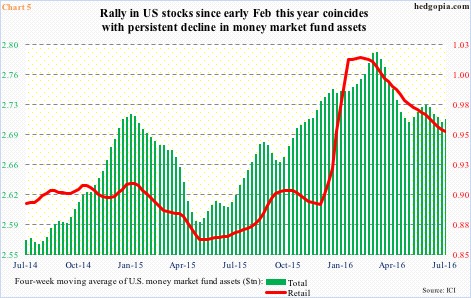
The breakout has the potential to be a big one given the duration of sideways action. Using measured move target, most technicians are eyeing 2400. This scenario assumes the retail crowd decides the breakout is genuine … or, if institutions succeed in luring retail into jumping on the bandwagon.
As of last Wednesday, there was $2.72 trillion in money-market funds, $1.77 trillion in institutional and $954.5 billion in retail. The total has been trending lower since early March this year, when funds were $2.81 trillion. Stocks bottomed on February 11th this year.
Chart 5 calculates a four-week moving average of money-market funds. Both total and retail have been in a downtrend, and that has helped stocks. The thing is, in the right circumstances, they can go a lot lower. In April last year, total assets bottomed at $2.58 trillion. Equity bulls could not ask for a better scenario.
In this respect, both the green and red lines in Chart 1, too, have tons of room for continued unwinding. So does the NAIIM reading. Lots of times in the past, the green line in Chart 2 has gone sideways from elevated readings, and that helps the red line rise. Once again, this is only possible in a perfect scenario.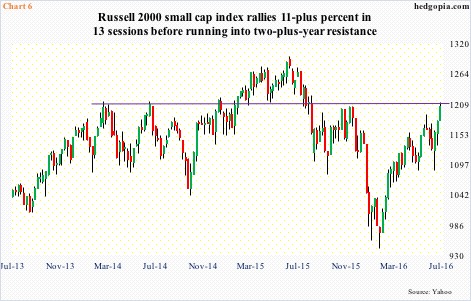
As things stand, the reality is that not all the wheels are moving in sync in the current rally. Most notably, the Nasdaq composite and the Russell 2000 small cap index are substantially below their all-time highs – by four percent and 7.5 percent, respectively. The Dow transportation index is nowhere near its old highs.
Post-Brexit, the Russell 2000 found support at 1080, then rallied 11-plus percent in 13 sessions. This has brought the index right under horizontal-line resistance drawn from March 2014 (Chart 6). Regardless it breaks out or not near term, its underperformance versus larger peers is a reflection on how markets view where the economy is headed.
Unlike large-caps, small-caps by nature are exposed solely/more to the domestic economy.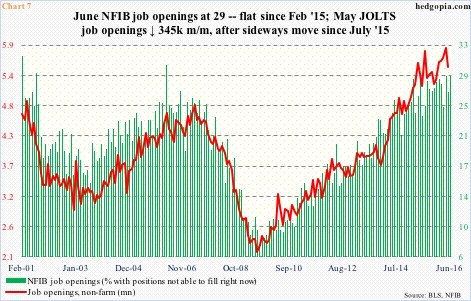
Chart 7 plots two sets of data pertaining to job openings – one out of the JOLTS report and the other from the National Federation of Independent Business. Both have been experiencing rather sideways tendency for a while now.
Non-farm job openings fell 345,000 month-over-month in May to 5.5 million. April was revised higher to 5.85 million and was 5.79 million prior to the revision, matching the reading in July last year – sideways for 10 months. Similarly, the percent of small businesses with positions not able to fill right now stood at 29 percent in June, unchanged from February last year. Both could very well weaken in the months to come. This is a medium- to long-term worry.
Right here and now, equities are not looking out that far. They are rather focused on 2Q16 earnings, and the low hurdle to jump over. It has been two weeks since the quarter ended, and operating-earnings estimates for S&P 500 companies have already dropped by $0.28, to $28.04. They were $33.27 at 1Q15.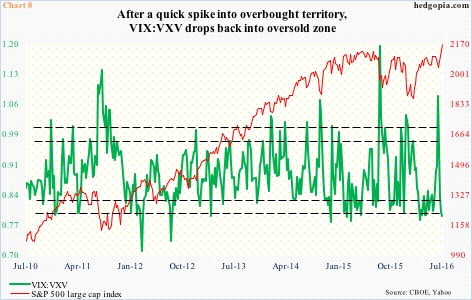
Going back five quarters to 1Q15, except for 4Q15, the S&P 500 was higher within a month of quarter-end. This phenomenon is once again at play. But with this, technicals have gotten extended, raising the odds that the green line in Chart 8 begins to unwind its oversold conditions. Spot VIX last Thursday dipped to 12.14 – the lowest since August 5th last year.
The tone and magnitude of the impending decline will decide where stocks might be headed in the medium term. Bulls first need to defend breakout retest on the S&P 500, which is 1.3 percent away. Then comes 50- and 200-day moving averages (both are beginning to turn up, by the way), followed by 1990, and so on.
So to answer the rhetorical question in the opening paragraph, it might be time to play a little contrarian, at least near term.
Thanks for reading!
