
For first time in over four years, the 10-year Treasury rate surpasses three percent, only to raise the possibility that this is as high as it is going to go at least in the short term.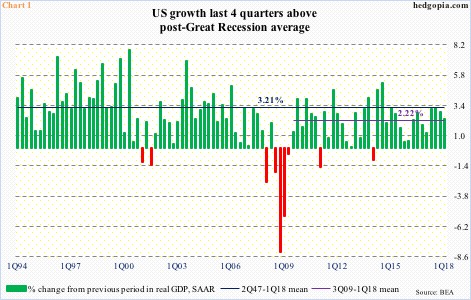
After several quarters of decent growth, US data is beginning to soften. Real GDP grew 2.3 percent in 1Q18. This followed growth of 2.9 percent in 4Q17, and 3.2 percent and 3.1 percent before that.
Despite this seeming deceleration, in all these four quarters the economy grew above the post-Great Recession average of 2.2 percent (Chart 1). In fact, 3Q17 matched the long-term average of 3.2 percent.
One month short of completing nine years of recovery, the current pace is hard to sustain.
Elsewhere, the ISM manufacturing index in March fell 1.5 points month-over-month, but February’s 60.8 was the highest since 61.4 in May 2004. In August 2016, activity went sub-10 to 49.9, before expanding. Mean reversion is natural. (April’s numbers are due out Tuesday.)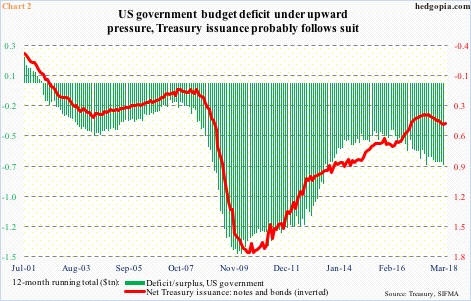
The tax cuts of last December plus subsequent fiscal stimulation will help, but this will come at a cost – in the form of higher budget deficit, which is already running high. In the 12 months to February, the US government accumulated $706.2 billion in red ink. This has trended higher beginning February 2016.
As go the green bars in Chart 2, so does the red line, which represents a 12-month total of issuance of Treasury notes and bonds. In March, issuance totaled $424 billion, up from $335 billion last July.
There are some interesting dynamics in play here.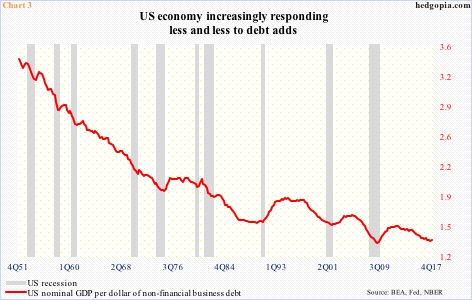
Simplistically, more issuance means yields come under upward pressure, even as a softer economy can lead to increasing demand for these instruments, meaning yields go the other way. We can throw another variable to the mix, which is the amount of leverage in the system – government, corporate and individual.
The US economy’s reliance on leverage has persistently risen over time.
When Great Recession ended, federal debt stood at $11.5 trillion. In 4Q17, it was $20.5 trillion (latest count is $21.2 trillion). Between the periods, household debt (home mortgage and consumer credit) went from $13.2 trillion to $13.9 trillion, while non-financial business debt jumped from $10.5 trillion to $14.3 trillion.
Chart 3 takes a ratio of nominal GDP to non-financial business debt. It speaks for itself. Increasingly, it is taking more and more debt to produce the same amount of output.
Leverage – and by default interest payments – in and of itself should inhibit a sustained rise in interest rates.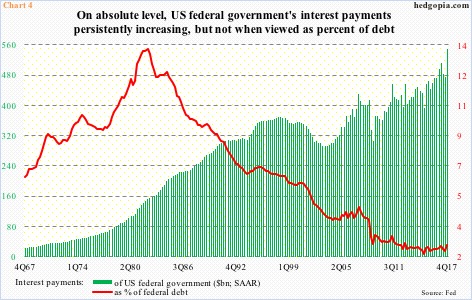
Back in 2Q09 when Great Recession ended, the federal government effectively paid an interest rate of 3.2 percent; interest payments were $372 billion (seasonally adjusted annual rate). Fast forward to 4Q17, these payments totaled $549.5 billion, but the effective rate dropped to 2.7 percent (Chart 4).
By keeping the fed funds rate low on the short end and simultaneously deploying quantitative easing on the long end, the Fed kept rates suppressed. Assuming rates were 3.2 percent in 4Q17, federal interest payments would be $652 billion.
Since December 2015, the fed funds rate has gone up by 150 basis points to a range of 150 to 175 basis points, but historically rates are still low. Ditto with the long end.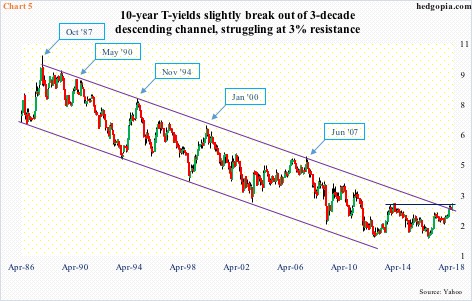
Thus the significance of how 10- and 30-year Treasury yields have behaved of late.
Ten-year notes have been in a bull market for over three decades, with yields caught within a descending channel (Chart 5). Since reaching an all-time low of 1.34 percent in July 2016, yields have trended higher.
In January, the 10-year rate broke out of resistance at 2.62 percent. Then it managed to poke its head out of the channel. If genuine and sustained, this can prove to be a major development in the bond market, with repercussions across a whole host of assets in due course. But is it? Even better, can the economy deal with a sustained rise in rates?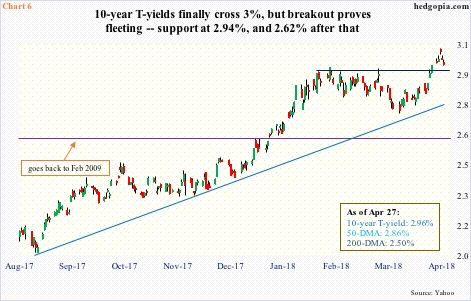
Once again, the issue at hand is the leverage, and the cost it will entail through higher interest payments. In this scenario, the 10-year yielding three percent could be viewed by many a shop as an opportunity to go long these notes.
Tuesday last week, 10-year yields (2.96 percent) crossed three percent (intraday high of 3.04 percent Wednesday) – the first time this has happened since January 2014. The breakout proved fleeting. As early as early this month, these notes yielded 2.72 percent.
In the end, last week ended with a shooting star. Fatigue is showing up. There is room for yields to continue lower. In getting thus far, the 10-year managed to forge decent support at 2.94 percent. Plus, breakout retest takes place at 2.62 percent.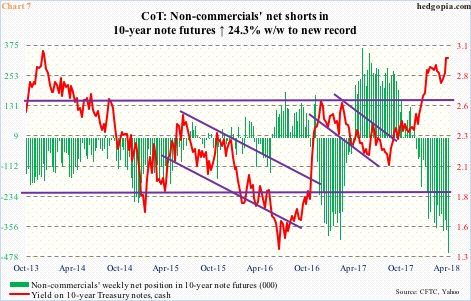
Non-commercials can prove to be the wildcard in all this.
These traders have built up a record amount of net shorts in 10-year note futures – 462,133 contracts – and deserve the kudos, in that they rode the recent decline in these notes perfectly. Early December last year, the 10-year was yielding 2.31 percent, and that is when non-commercials flipped to net short (Chart 7).
Thus the urge to lock in profit should they conclude that the recent move north of three percent is as far as the 10-year going to go in at least the short term. Yields head lower in this scenario. In other words, TLT (iShares 20+ year Treasury bond ETF) heads higher.
Last week the ETF ($118.89) produced a potentially bullish hammer candle. Wednesday’s intraday low of $116.94 was higher than the low of $116.51 on February 21. The daily chart is oversold, and has room to rally, particularly if the 50-day ($119.41) gets taken out.
Hypothetically, June 1 TLT 118 short put is going for $1.08. It is naked, hence, if put, it is a long at $116.92. Else, the premium is kept.
Thanks for reading!
