
U.S. equity bulls regained momentum last week, but this also put near-term sentiment at/near complacency.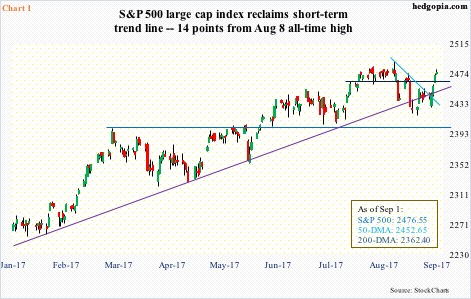
Since rising to an all-time high of 2490.87 on August 8, the S&P 500 large cap index was bound by a falling trend line (Chart 1). This was broken last week.
Also last week, after remaining under for several sessions, it recaptured the 50-day moving average. The index is now merely 14 points from that high.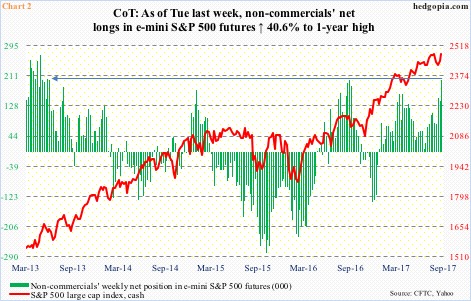
Last week, the cash rallied 1.4 percent. This was accompanied by a 40.6-percent increase by non-commercials in net longs in e-mini S&P 500 futures.
The 199,731 contracts – up 122,759 over the past three weeks – these traders held as of Tuesday last week were at a one-year high, but essentially on par with peaks going back over four years (arrow in Chart 2).
Peak or near-peak optimism?
It is too soon to declare that, but we do know this. Seen through options, sentiment near term is at/near complacency.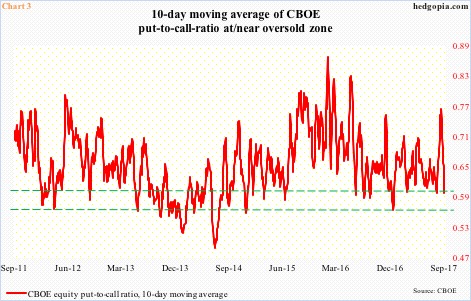
In four of five sessions last week, the CBOE equity put-to-call ratio was in the .50s, and in seven in the last 10.
As a result, the 10-day ratio last Friday dropped to .593, which is low enough to signal complacency near term (Chart 3). Which in other words means potential headwind for stocks.
To be clear, the 21-day ratio is still at a rather elevated .676 (not shown here). But the 10-day is what can drive near-term sentiment.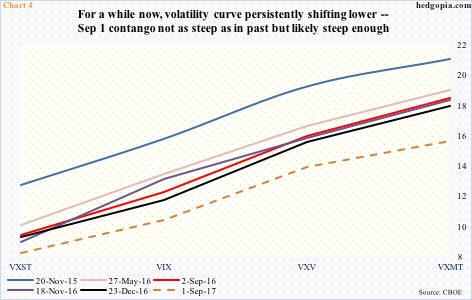
Also last Friday, spot VIX (10.13) once again nearly dropped to single digits – intraday low of 10.02, down from 17.28 on August 11. Premium for near-term protection got squeezed fast.
Friday, VXST closed at 7.94. It made an all-time low of 6.99 on July 21. The volatility curve – VXST (nine days)-VIX (30 days)-VXV (90 days)-VXMT (six months) – is obviously in contango, with the spread currently between VXST and VXMT of minus 7.39. In the five other instances in Chart 4, the spread was in the minus eight to nine range. That does not mean the curve cannot begin to unwind. It is steep enough.
In this scenario, stocks drop.
Immediately ahead, support lies at 2465 on the S&P 500 (Chart 1). After that is a confluence of support at 2450-plus – 10-, 20- and 50-day. The latter is a must-hold. Else, the pendulum swings in favor of the bears again, raising odds of a retest of 2400.
Thanks for reading!
