
The last data point in Chart 1 is as of yesterday and uses intra-day highs rather than the close. The VIX-to-VXV ratio is calculated by using 22.89 for VIX and 23.53 for VXV. They respectively closed the session at 19.37 and 21.16. Using the closing price would result in a ratio of 0.915, rather than the 0.973 used in the chart. Also on Tuesday, the ratio rose to 0.972 intra-day.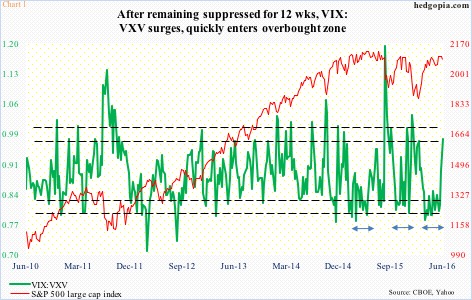
Market participants have been actively buying short-term protection. It is volatility’s this behavior that leads to unwinding of the oversold conditions the ratio was in before it started rising last week with a surge this week. The ratio remained suppressed for 12 long weeks.
Not that the green line in Chart 1 cannot continue pushing higher. It has in the past, as is evident. But with each push higher, reversal odds grow.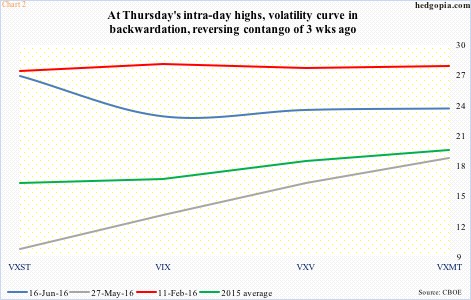
The VXST (nine days)-VIX (30 days)-VXV (90 days)-VXMT (six months) curve shows the near panic yesterday in buying short-term protection. Chart 2 uses yesterday’s intra-day highs. VXST shot up to 26.94, north of three points higher than VXMT. In less than three weeks, the curve shifted from steep contango (grey line) to backwardation (blue line).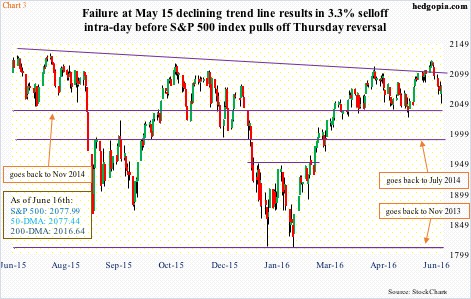
The spike in volatility has come in the midst of rather gentle selling in the S&P 500 large cap index. From June 8th through yesterday’s intra-day low, the index dropped 3.3 percent (Chart 3). That’s it! VIX in the meantime jumped 10 points in eight sessions, and went from the lower Bollinger Band to the upper in no time.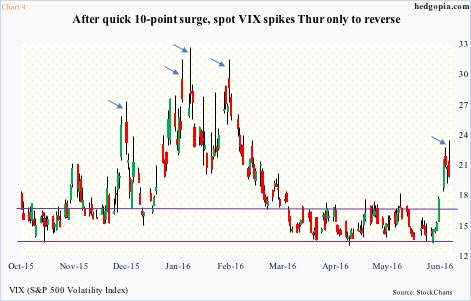
VIX’s candle yesterday has an ominous look to it (Chart 4). Several times in the past spot VIX has surged, only to reverse hard and then sell off. Daily conditions are grossly overbought. And in the event of a ‘no’ vote on Brexit on the 23rd, risk-off likely reverses fast near term.
In fact, this scenario is precisely what the S&P 500 seems to be anticipating. Yes, the index has lost shorter-term moving averages, and lost the 50-day as well before recapturing it yesterday. But, it has not fallen apart given the steep jump in near-term volatility.
This is particularly so as the S&P 500 has failed to break out of the trend line drawn from the all-time high of May 2015 (Chart 3). Normally, a failure of this nature results in a sharp sell-off… has not happened yet. Yesterday, it reversed with a hammer, although volume could have been better.
Near-term, although the two have diverged, pretty soon either the S&P 500 rallies, putting downward pressure on spot VIX, or the latter remains firm and the S&P 500 rolls over. On a weekly chart, there is plenty of room for the latter to go down.
That said, equity bulls should take heart from yesterday’s action in VIX.
In times like these, a spike reversal on spot VIX has proven to be a reliable signal in the past (arrows in Chart 4). There was one yesterday.
Thanks for reading!
