
Since the intraday low on Boxing Day, SPY is up nearly 11 percent. Too far, too fast? Possibly, as the ETF is just a hair breadth away from support-turned-resistance at 260, which it lost mid-December.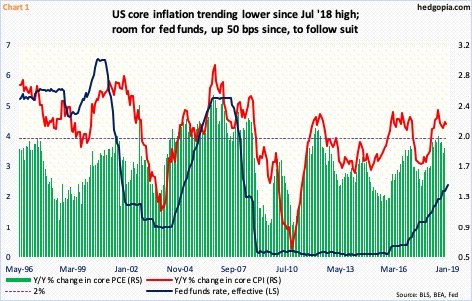
The Fed has a dual Congressional mandate of maximum employment and stable prices. But it seems to have evolved over time – particularly the past two decades. Increasingly, it seems the central bank is as serious about influencing the financial markets.
On October 3, Jerome Powell, Fed chair, said rates were still “a long way” from neutral, suggesting continued tightening in the weeks/months ahead. On that very day, the S&P 500 large cap index began what soon turned out to be a waterfall dive. The FOMC did go ahead and raise the fed funds rate by 25 basis points in the December 18-19 meeting to a range of 225 to 250 basis points – its ninth 25-basis-point hike since December 2015. Stocks continued to drop, despite a U-turn from Powell on November 28 when he said interest rates were “just below” neutral. Markets demanded more explicit language. On January 4, Powell said he is “listening sensitively to the message that markets are sending,” about downside risks to the economy, adding “we will be prepared to adjust policy quickly”.
The advantage Powell, and other FOMC members, have is, depending on their hawkish or dovish bias, they can toggle between jobs and inflation. The Phillips Curve is dead in the current cycle. The US unemployment rate has remained sub-four percent in the past six months, but inflation remains subdued. Core PCE and CPI have trended lower since reaching multi-year highs last July (Chart 1). Last Thursday, Powell said inflation is “low and under control,” hinting where his focus might lie in the months ahead.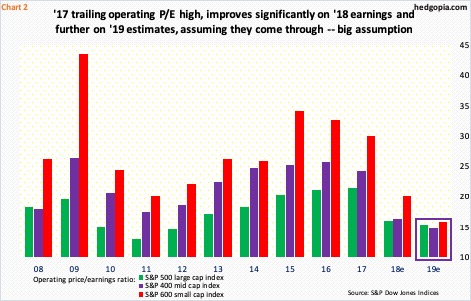
As opposed to the October-December rout, stocks are much calmer (Chart 5). From the Boxing Day low to last Friday’s high, the S&P 500 is up 10.6 percent. This, in combination with downward revision in earnings estimates, quickly put upward pressure on forward valuation multiples.
Chart 2 plots the operating P/E for S&P 500/400/600 companies. With one quarter to go, 2018 multiples look a whole lot better, thanks to corporate tax cuts of December 2017, but they are not cheap. In this respect, even 2019 multiples – in the 15x range – are not inexpensive. The revision trend is decidedly down, and odds favor this will continue.
Early August last year, 2019 S&P 500 estimates peaked at $177.13. Wednesday last week, they were $170.31. Even now, the sell-side expects earnings to grow 8.5 percent this year. This would have come after a projected 26-percent jump this year. Even assuming the index goes sideways from current levels, lower earnings will push up multiples.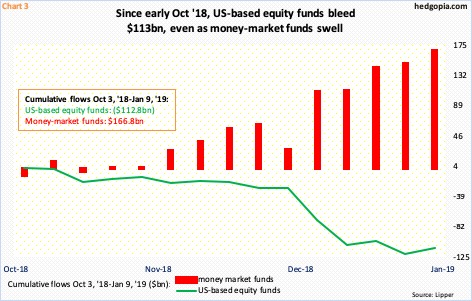
Stocks took quite a hit during the three-month selloff. But this probably was still not sufficient for value investors to drool over. The buying frenzy over the past couple of weeks could very well be due to the unwinding of oversold technical conditions or shorts locking in gains. We will find out in due course.
What we do know is this. Since the week to October 3 through the one ended last Wednesday, US-based equity funds lost $112.8 billion. The latest week saw inflows of $8.7 billion, but this is pittance to what came out. In the meantime, massive amounts have moved into money-market funds – $166.8 billion. Equity bulls obviously hope this money finds its way into stocks. In this scenario, short interest can help.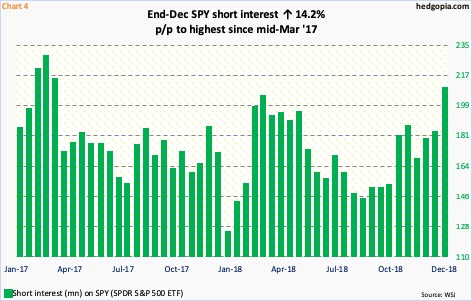
At the end of December, short interest on SPY (SPDR S&P 500 ETF) jumped 14.2 percent period-over-period to 208.9 million. This is the highest level since mid-March 2017 (Chart 4). From the end of September, short interest rose 37.8 percent. These shorts fared very well. During the three-month collapse, the S&P 500/SPY tumbled just north of 20 percent.
It is possible they locked in some of the gains in the current period. From the Boxing Day low through Friday’s close, SPY quickly rallied 10.8 percent. Year-to-date, it is up 3.6 percent. Mid-January numbers will be reported on the 25th. We will find out if short-covering played a role in the rally the past couple of weeks.
As far as bulls are concerned, the rather-elevated short interest amounts to dry powder, if they can force a squeeze. That said, short interest is not elevated across the board.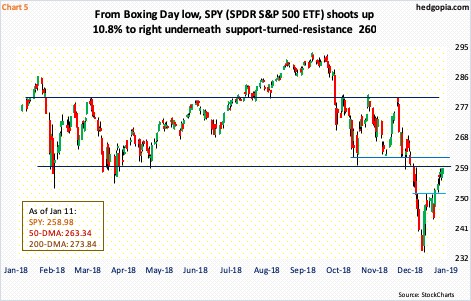
SPY in this regard sits at a crucial juncture.
During the October-December decline, one after another support gave way. These are all levels where sellers can/are likely to show up. SPY is right underneath one such level. For months last year, the ETF played ping pong between $280 and $260 (Chart 5). The latter was lost mid-December, which was promptly followed by another round of selling.
Last Thursday, SPY rose as high as $259.16. From the late-December low, it already rallied double-digits. On the weekly, there is room for more, but the daily is now extended.
On Christmas Eve, merely 1.2 percent of S&P 500 stocks were above their 50-day moving average. This was as washed-out as it could get. Last Thursday, this metric rose to 40 percent, with Friday at 38.6 percent. In the best of circumstances, this can rise to 60s and 70s, but, near term, digestion of the recent gains is the path of least resistance, particularly so if SPY takes out 260, in which case it has a shot at 263, which also approximates the 50-day at $263.34. By that time, daily momentum indicators would have entered deeply overbought territory.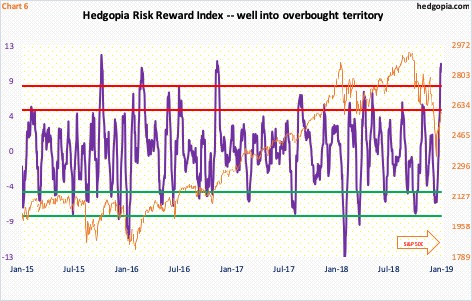
Speaking of which the Hedgopia Risk Reward Index bottomed on December 27 in the green zone. It then went vertical. It currently sits well into overbought territory (Chart 6). If past is prologue, this gets unwound. When that happens, the S&P 500/SPY comes under pressure.
Once again, looking at Chart 5, SPY ($258.98) has come a long way in just a couple of weeks. Last week, it rallied 2.6 percent. The January 25th SPY 248 put hypothetically sold a week ago at $3 now sells at $0.61. A closure nets $2.39. Another way to play this is to continue to hold the short put and turn this into a short strangle by adding a short call. In the same expiration, 260 call sells at $2.52. Overall, $5.52 is collected in premium. Accordingly, it is now a short at $265.52 and a long at $242.48. On the downside, it has to drop 6.4 percent before it starts bleeding. Risk-reward odds are decent.
Thanks for reading!
