
Ten-year Treasury yields rallied last week to right underneath the top end of a three-decade-old channel. A breakout has to wait for now.
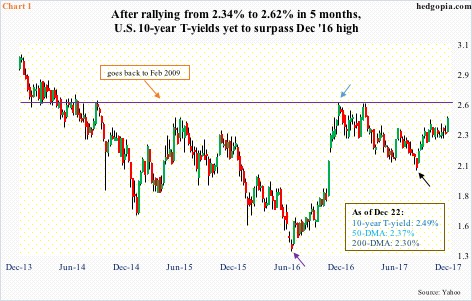 The 13-basis-point jump last week was big, and probably took many by surprise. At one point, yields were up 14 basis points to 2.5 percent – a nine-month high and past the 50-day moving average as well as the 10- and 20-day. These averages are all rising. Not the 200-day, though, which is flattish to slightly declining.
The question is, why are these yields rallying?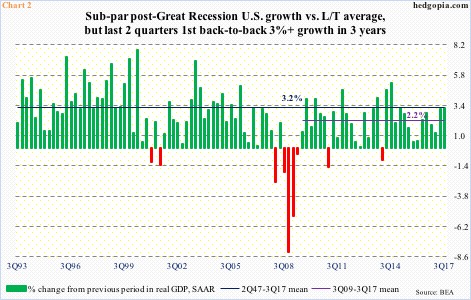
One simplistic answer is just the excitement around tax cuts – signed into law last Friday and which at least the Trump administration believes will push real GDP growth toward three percent.
These yields have been rallying for a while now. Early September this year, they bottomed at 2.03 percent (black arrow in Chart 1).
In recent quarters, macro data have firmed up.
Real GDP expanded 3.2 percent in 3Q17. This followed growth of 3.1 percent in 2Q17. This was the first time since 4Q13 that the economy put up two three-plus-percent quarters back-to-back.
In fact, growth in the last two quarters compares favorably with the long-term average of 3.2 percent and is substantially above the post-Great Recession average of 2.2 percent (Chart 2).
Further, as of last Friday, the Atlanta Fed’s GDPNow model puts 4Q17 growth forecast at 2.8 percent. These are very good growth rates, and, if sustained, are bound to put upward pressure on interest rates.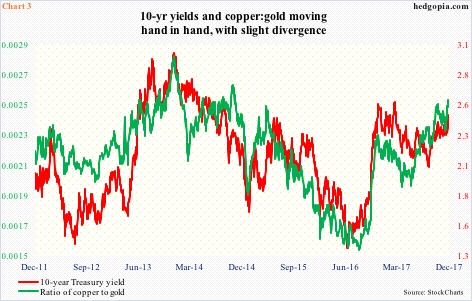
Or yields may simply be following the ratio between copper and gold.
Copper – a base metal – is traditionally known as Dr. Copper because of its widespread applications in various sectors of the global economy, hence also used to predict turning points. Gold, on the other hand, is treated as a safe haven, and is in demand particularly when growth is lackluster or contracting and when the investing environment is risk-off.
Understandably, when copper prices are rising faster than gold, the global economy is supposed to be humming along. At least in theory.
With that said, copper is in abundance, gold – a precious metal – is rare. Temporary supply-demand imbalances, among others, can always put upward pressure on copper prices.
In July last year, when 10-year yields bottomed (violet arrow in Chart 1), so did the copper-to-gold ratio. The two have risen in tandem, as they usually do.
A closer look at Chart 3, however, is a bit revealing. On a closing basis, yields are still laboring under the March 2017 high, even as the ratio is at the highest since April 2015. A slight divergence, so to speak.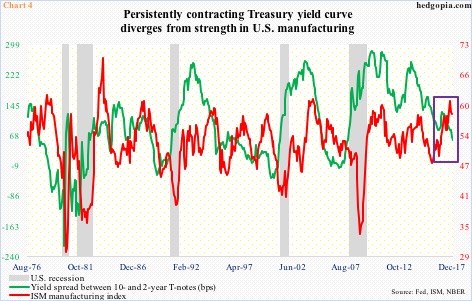
Speaking of divergence, here is another (Chart 4).
For a while now, U.S. manufacturing has put up strong numbers. The ISM manufacturing index dropped five-tenths of a point month-over-month in November, but September’s 60.8 was the highest since 61.4 in May 2004.
The only problem is that the green line in Chart 4 – the spread between 10- and two-year Treasury yields – refused to follow the red line higher. Last Friday, the curve narrowed to 57 basis points, down from 61 basis points two days prior but on the 15th this month it fell to 51 basis points.
To be clear, the yield curve is nowhere near inversion, which more often than not precedes a recession. But the inability of the long end to follow the short end higher probably does not point to a period of rip-roaring growth ahead.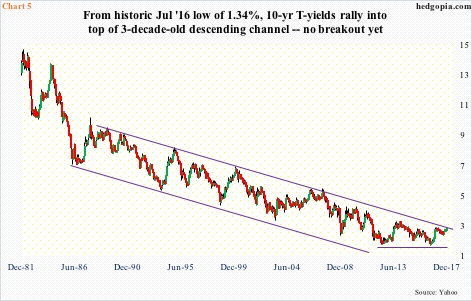
In the end, last week’s rally in 10-year yields – now overbought on the daily chart – could simply be a case of unwinding of the oversold condition they were in. On Wednesday through Friday last week, they closed on and around the daily upper Bollinger band.
Importantly, these yields finished the week right underneath the top end of a three-decade-old channel (Chart 5). A breakout can have massive consequences.
Because it is a descending channel, with the passage of time, the level where a breakout occurs, continuously declines. In March this year, it was just north of 2.6 percent. This was also a level – 2.62 percent, to be precise – reached last December (blue arrow in Chart 1), and unsuccessfully tested in March this year.
If bond bears are serious this time around, they will have to first break out of the channel in order to once again go attack 2.6 percent – possible, but not probable right at this moment.
The most likely path for now is for these yields to go back down and hold support. The 50-day, for instance, is at 2.37 percent. This would give the bears an opportunity to reload.
This could soon open up a trading opportunity in TLT (iShares 20+ year Treasury bond ETF), which shed 2.6 percent last week – along the lines of a credit put spread to at least earn some premium. Wait and watch for now.
Thanks for reading!
