
- Sellers take advantage of early-morning strength to sell more stocks
- Amidst this, transports, high-yields draw buyers; panic noticed in VIX:VXV action
- Trade could be developing, but given developments in energy space, sustained rally not probable
Another ugly day! Could have been worse, though. Could have been better as well if early-morning action held through the day. But the opening strength was sold right out of the gate. When it was all said and done, the S&P 500 Large Cap Index lost its 50-day moving average. Ditto with the Dow Industrials. The Russell 2000 Small Cap Index broke down, falling out of a well-defined range and in the process also losing its 50- and 200-day. The Nasdaq Composite is 25 points away from its 50-day. On all of these averages, there is now a 10-20 crossover, with both averages pointing down. The message is that these indices can continue to come under pressure.
So what happened to the seasonally reliable Santa Claus rally? It is possible that, post-October 15th bottom, it came early. Or simply that there are 11 more sessions left before the month is over, so anything can happen between now and then. In fact, yesterday’s session also left some breathing room for the bulls. This is probably as good an opportunity as they can get to force an end-of-the-year rally.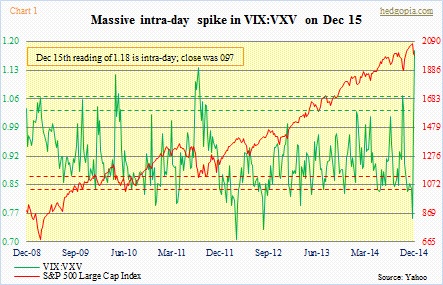
Particularly on the S&P 500 on a weekly basis, momentum indicators such as the CCI and RSI are in the middle of the range. These are spots that tend to produce a lot of push-and-pull action between bulls and bears. We saw that in transports yesterday, with the Dow Jones Transportation Index closing in the green. Another telltale came from high-yield bonds. As have been repeatedly pointed out on this blog how they had been diverging from large-cap stocks, it is a definite plus that there is some buying interest, however fleeting. JNK closed green, HYG was essentially flat.
Intra-day yesterday, some level of panic could be felt. At their highs, VIX:VXV shot up to 1.18, which is what is shown in Chart 1 so that we gain some perspective into the day’s action. By close, both were substantially lower, for a ratio of 0.97.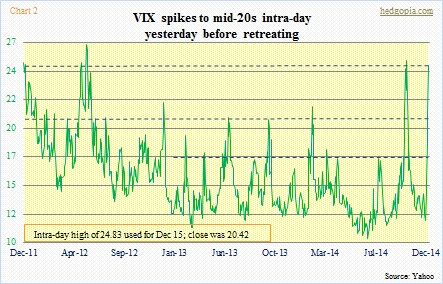
There was a similar message coming out of the VIX itself. For the umpteenth time the past few years, the so-called fear index has spiked only to retreat quickly. And these instances have proven to be good opportunities to go long equities. It is too soon to say if we are in the midst of one, but a process could very well be in the making. The past two sessions, VIX action is regarded as neutral, and signifies indecision between longs and shorts. It is entirely possible it pulls back here, finds support at its 50- and 200-day before reasserting itself.
We will get some clues today, and particularly tomorrow when the FOMC meets. (We will also hear from Chair Janet Yellen tomorrow.)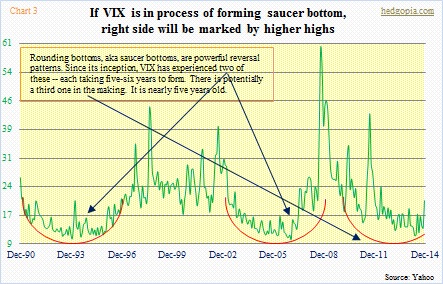
If a bounce is on the docket, then it probably stays that way. Given what is going on in the energy space, and yet-to-be-fully-determined repercussions across the job market, capital expenditures, and earnings, it is hard to ignore realities and bull up. What is the signal coming from the collapse in the oil price? That a slowdown awaits the world economy next year? It is possible. Indeed, there is a chance the VIX goes on to make higher highs next year, completing the right half of what could be a saucer bottom (Chart 3).
