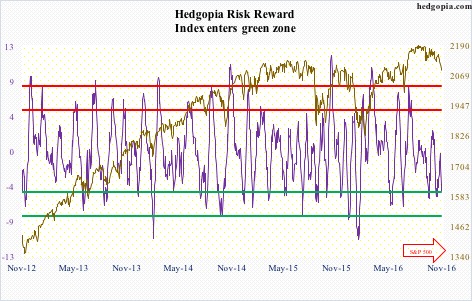
Following futures positions of non-commercials are as of November 1, 2016.
10-year note: The 10-year yield (cash) has been trapped in a descending channel for the past three decades, having peaked at 15.8 percent in September 1981.
From the July 6th all-time low of 1.34 percent through the November 1st high of 1.88 percent, it rallied 54 basis points. Yields are past both 50- and 200-day moving averages.
The November 1st high tested horizontal resistance going back to September 2011 – so far unsuccessfully. Yields closed out the week at 1.78 percent. On both daily and weekly basis, there is room for continued pressure. The 200-day moving average lies at 1.71 percent and the 50-day at 1.69 percent.
Concurrently, TLT, the iShares 20+ year Treasury bond ETF, having dropped nearly nine percent from the July 8th record high, remains grossly oversold. On Wednesday, a rally attempt was denied at the 200-day moving average. At the same time, bulls are beginning to step up, with the ETF up 1.2 percent for the week.
Currently net short 35.1k, down 109.6k.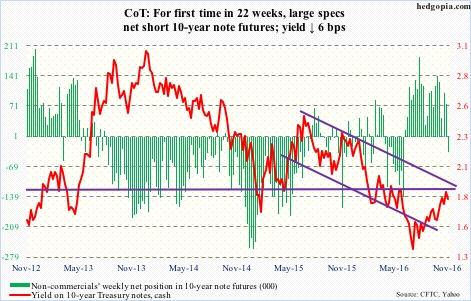
30-year bond: Major economic releases next week are as follows.
The Labor Market Conditions Index for October is reported on Monday. Supposedly, Janet Yellen, Fed chair, closely watches this metric. September was -2.2, with eight out of last nine months in negative territory. The six-month moving average has been in negative territory for six straight months.
Tuesday brings the NFIB small business optimism index (October) and JOLTS (September).
Optimism among small businesses came in at 94.1 in September, a four-month low. The cycle peaked at 100.3 in December 2014 – the highest since 100.7 in October 2006.
Non-farm job openings in August fell by 388,000 m/m to 5.44 million. The July high of 5.83 million was on par with 5.79 million in July last year and 5.85 million in April this year – hence essentially flat for over a year.
November’s preliminary estimate of the University of Michigan’s consumer sentiment index is published on Friday. October dropped four points m/m to 87.2 – a 13-month low. The cycle high was reached in January last year at 98.1, which was an 11-year high.
Four FOMC members are scheduled to speak on weekdays.
Currently net short 4.2k, down 8.6k.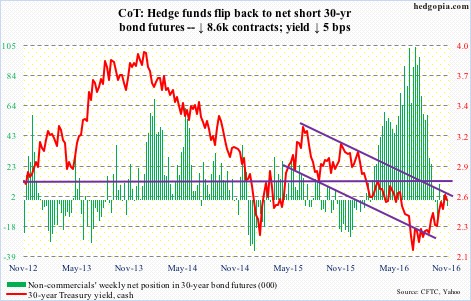
Crude oil: In the EIA report this week, traders decided to focus on crude stocks and imports, not on gasoline and distillate stocks. On Wednesday, spot West Texas Intermediate crude dropped 2.9 percent to $45.34/barrel – past $46.40-ish support, and then lost another 2.8 percent on Thursday and Friday to $44.07.
In the week through November 2, crude inventory rose by a massive 14.4 million barrels to 482.6 million barrels – a nine-week high.
Crude imports increased by two million barrels per day to nine mb/d. This was the highest since the week through September 14, 2012.
Gasoline stocks, on the other hand, fell by 2.2 million barrels to 223.8 million barrels – the lowest this year. And distillate stocks dropped by 1.8 million barrels to 150.6 million barrels – a 17-week low.
In the meantime, crude production rose a tad, by 18,000 b/d to 8.5 mb/d – a 10-week high. Production peaked at 9.61 mb/d in the June 5th week last year.
Refinery utilization fell four-tenths of a point to 85.2.
The loss of $46 on spot WTI breaches the rising trend line from February this year – potentially important development. For now, the crude is oversold. At Friday’s low, it was merely 0.4 percent from testing the 200-day moving average ($43.38). Oil bulls cannot afford to lose this support.
Currently net long 314.4k, down 49.6k.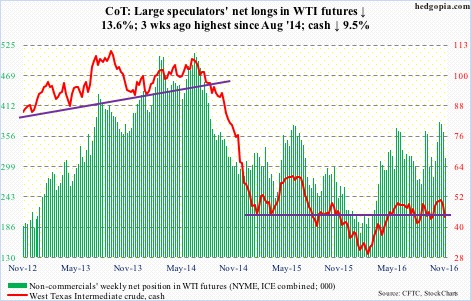
E-mini S&P 500: In the week through Wednesday last week, SPY, the SPDR S&P 500 ETF, attracted $1.3 billion (courtesy of ETF.com); yet, the S&P 500 (cash) for the whole week dropped 0.7 percent. This week, there were outflows of $1.1 billion – and the S&P 500 went on to lose another 1.9 percent.
Support at 2120 was lost. This support/resistance goes back to February last year. In September and October this year, 2120 was tested several times and held. Not on November 1. The loss of this price point preceded the loss last week of a rising trend line drawn from February this year.
Also in the week to Wednesday last week, a whopping $16.6 billion came out of U.S.-based equity funds (courtesy of Lipper). This week, another $3.4 billion was redeemed.
On a related note, NYSE margin debt jumped 6.3 percent m/m in September to $501.1 billion. The S&P 500 was down 0.12 percent in that month. Turns out it was a bad time to lever up as the S&P 500 is down 3.8 percent since September-end.
The S&P 500 has lost two crucial levels – 2120 and the February trend line. It is currently sitting at the 200-day moving average, which has not been tested since the Brexit low in June this year. It is a must-hold.
Currently net short 20.7k, down 743.
Euro: The Eurozone economy grew by 0.3 percent in 3Q16, unchanged sequentially – not enough to generate inflationary pressures. Inflation inched up to 0.5 percent in the year to October from 0.4 percent in September. As subdued as it is, October’s inflation was the highest since June 2014.
Currently, markets expect the ECB to indicate at its December meeting that it would be expanding its current €80-billion/month asset purchase program beyond March next year.
Regardless what comes out of the December 8th meeting, for now, the euro is taking the cue from technicals. It rallied 1.4 percent for the week – past the 50-day moving average. The 200-day is right above. The daily chart is beginning to look extended, although there is room to rally on a weekly basis.
Currently net short 137.4k, up 13.5k.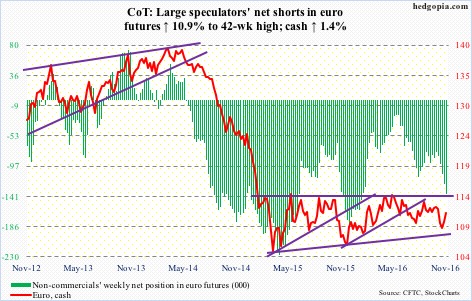
Gold: The $1,300-plus/ounce level has proven to be important, providing support in June through September this year. This support/resistance can be extended as far back as September 2010.
On October 4, once $1,300 was lost, spot gold collapsed 3.3 percent, followed by a long stretch of hovering around the 200-day moving average. Then came the liftoff. On Tuesday and Wednesday, gold rallied 2.8 percent to $1,308.2 – past the 50-day moving average but right at the said resistance.
A declining trend line drawn from the July high will be tested around $1,330.
On a weekly chart, there is room for the spot to continue to rally, but daily conditions are way overbought.
Flows are not cooperating. In the five sessions through Wednesday, gold rallied 3.3 percent, yet GLD, the SPDR gold ETF, saw activity only once – inflows of $109 million on Tuesday. From October 7 when the metal began to rally, it lost $107 million (courtesy of ETF.com).
Currently net long 215.1k, up 18.2k.
Nasdaq 100 index (mini): Last week, the Nasdaq 100 index scored a new all-time high of 4911.76 before losing near-term support at 4840. This week, it dropped three percent to 4660.46 to also lose one-year support at 4740. The 50-day moving average is now slightly dropping.
Since that October 25th peak, the Nasdaq 100 has dropped 5.1 percent – in nine sessions – even as in the three weeks ended this Wednesday $2.3 billion moved into QQQ, the PowerShares Nasdaq 100 ETF (courtesy of ETF.com). These longs are not happy.
Similarly, non-commercials’ net longs in Nasdaq 100 futures rose from 127,946 as of August 16 to a record 162,662 last week. The index (cash) is lower versus back then. These traders are probably not happy either.
In a worse-case scenario, there is support at 4570, with the 200-day moving average at 4535.94.
Currently net long 131.7k, down 31k.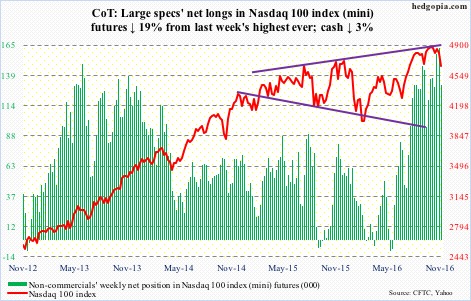
Russell 2000 mini-index: The loss of dual support – 1200 horizontal support going back to March 2014 and a rising trend line from February this year – is proving costly. The Russell 2000 lost another two percent this week.
In the week ended Wednesday, IWM, the iShares Russell 2000 ETF, lost $725 million. This followed outflows of $853 million in the prior week (courtesy of ETF.com).
At Thursday’s low, the Russell 2000 (cash) was merely 0.5 percent from testing the 200-day average (1150.39).
Currently net short 7.5k, down 13.8k.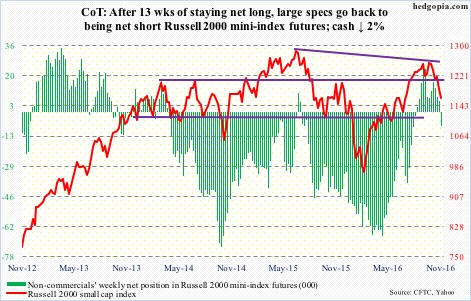
US Dollar Index: Since the early-May (2016) low, the dollar index (cash) has been trading within an ascending channel, the upper end of which was tested last week – unsuccessfully. This week, it lost 1.3 percent.
If it proceeds to test the lower end of the channel it is in, the cash (97.09) could be headed toward 96.
In a larger scheme of things, it continues to trade within $100-plus and $93-plus.
Currently net long 54.3k, up 340.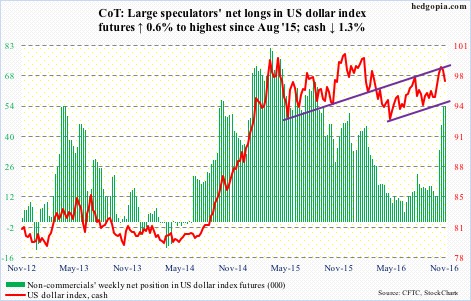
VIX: Protection is in high demand.
For the first time ever, spot VIX has rallied for nine consecutive sessions – from an intra-day low of 12.73 to a high of 23.01 (closed at 22.51). Daily momentum indicators are grossly overbought, but a spike reversal signal is yet to flash.
In the meantime, at 1.07, the VIX-to-VXV ratio is well into overbought territory.
In the right circumstances, both spot VIX and the ratio have room to drop to unwind overbought conditions. Needs a catalyst, a trigger. Tuesday next week is U.S. election. Fingers crossed.


