The following are futures positions of non-commercials as of October 27, 2015. Change is week-over-week.
10-year note: Once again, the Fed took a pass. Its decision this week not to raise interest rates was expected. What was not expected was markets’ spur-of-the-moment reaction to the FOMC statement.
Post-statement on Wednesday, the front end of the curve sold off hard, with the two-year yield rising eight basis points to 0.72 percent (closed the week at 0.75 percent)! The 10-year yield rose, too, up six basis points to 2.09 percent on Wednesday. What changed?
“In determining whether it will be appropriate to raise the target range at its next meeting, the Committee will assess progress—both realized and expected—toward its objectives of maximum employment and 2 percent inflation.”
The sentence above was interpreted as the Fed leaving the door open for a December rate hike. To be fair, global risks were mentioned in the statement, but not with the same level of concern as was the case at the September meeting.
But it also said economic growth is moderate, with a slowed pace of hiring. And of course, consumer inflation is below the Fed’s target of two percent. Is it any surprise that markets are not fully buying a ‘hike in December’ scenario?
In the futures market, traders boosted chances of a rate hike in December from 35 percent pre-FOMC statement to 50 percent after the release. It is a coin toss essentially – not a done deal, not according to these traders.
With that said, it is possible the Fed has really boxed itself in. Unless economic data deteriorate significantly in the next six weeks, it will now need a really good excuse not to move. If it indeed moves – not a base case on this blog – the key thing to watch is how the long end of the curve reacts.
Currently net short 35.7k, down 2.2k.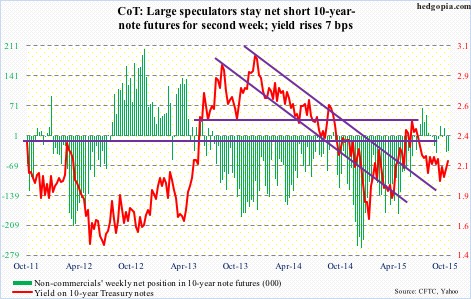
30-year bond: Next week’s major economic releases are as follows.
On Monday, we get the ISM manufacturing index for October. In September, it slid to 50.2 – the lowest since 50 in May 2013. The new orders index was 50.1 – on the verge of contraction and matching the December 2012 reading. This will be followed on Thursday by the non-manufacturing index, which is faring much better. The PMI was 56.9 in September – a three-month low – and orders 56.7 – matching the low of February 2015.
September’s non-durable goods data, plus revised data for durable goods, will be reported on Tuesday. The latter was reported this week, and was weak. Orders for non-defense capital goods ex-aircraft – a proxy for business capex – have contracted annually for eight consecutive months.
Preliminary productivity numbers for the third quarter will be reported on Thursday. Recent trends have been very disappointing. The last time non-farm output per hour grew year-over-year with a two handle was back in 3Q10.
Friday comes out the all-important employment report for October. Non-farm jobs momentum is on the wane. August and September saw sub-150,000 new jobs. Year-to-September, it has averaged 198,000, versus 260,000 in 2014. Wages are stuck in the mud, with annual growth in average hourly earnings of private-sector employees in the two-percent range throughout this recovery.
Eight FOMC members are scheduled to speak on weekdays. Let us get ready for conflicting messages!
Currently net short 20.2k, up 17k.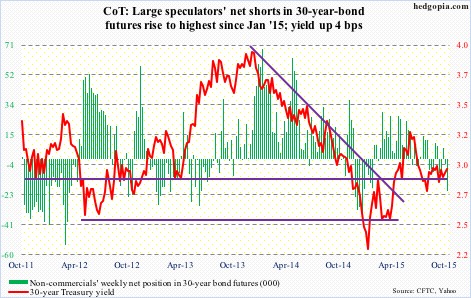
Crude oil: Once again, the $43 support on spot West Texas Intermediate crude was tested and saved. The action on Wednesday in particular was interesting as the WTI completely ignored the 0.9-percent rally in the US dollar index, surging 6.4 percent. The weekly EIA report was the catalyst.
For the week ended October 23rd, U.S. crude inventory rose by 3.4 million barrels, to 480 million barrels – the highest since the May 15th week. This was a fifth straight weekly increase. Days of supply came in at 31.1. As well, Production rose by 16,000 million barrels per day, to 9.11 mb/d. Production peaked at 9.61 mb/d in the June 5th week.
Other data were positive – relatively.
First off, gasoline stocks fell by 1.1 million barrels, to 218.6 million barrels – a six-week low. Days of supply was 23.9…Distillate stocks (diesel, heating oil, etc.) fell by three million barrels, to 142.1 million barrels – a three-month low. Days of supply was 35.8…Refinery utilization rose for the second week running, to 87.6 percent, up 1.2 percentage points week-over-week. Utilization peaked at 96.1 percent in the August 7th week…And last but not the least, crude oil imports fell to 7.03 million barrels – a four-month low – down 439,000 barrels from the prior week.
All in all, it was a good week for the WTI, up 3.7 percent. With that said, it is still stuck between $43 and $47-$48.
For a longer-term perspective, BP is cutting costs (capex, and asset sales) as it is now planning for around $60/barrel for Brent crude until at least 2017.
Non-commercials seem to be giving up, cutting net longs to the lowest since December 2012.
Currently net long 239.7k, down 30.1k.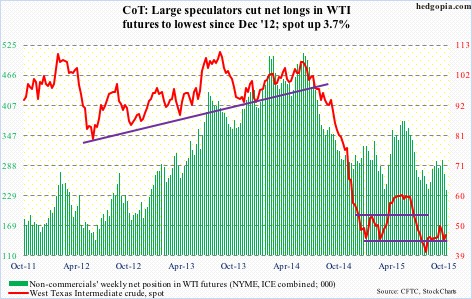
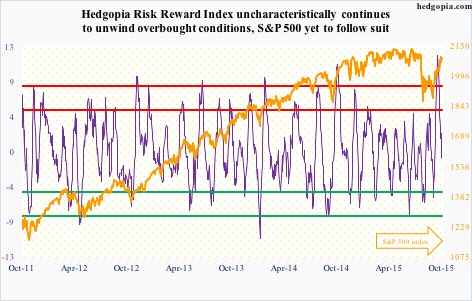
E-mini S&P 500: For the third straight week, U.S.-based equity funds have now seen inflows. In the week ended Wednesday, flows were $8.4 billion – the largest in six weeks (courtesy of Lipper). Although going back to the September 9th week, it is a wash – up a mere $761 million.
While the trend in recent weeks is good, the bigger question is, would it continue? Would fund managers, particularly those in need of making their year, begin to chase the rally?
As of Wednesday, money-market fund assets have gone up by $135 billion in the past six months, and by $42 billion since mid-August, to $2.72 trillion (courtesy of ICI). Having done a good job of squeezing the shorts, bulls are hoping – and positioned that way – at least some of this money begins to come back into stocks.
Then there is this. Since the September 29th low, the S&P 500 has rallied 11 percent. Which means plenty of buying power has been expended in such a short amount of time. Unless inflows cooperate, with two months remaining in the year, the urge to lock in profit will have risen with each passing day.
Consider this. Non-commercials reduced net shorts by 36 percent. The S&P 500 essentially went sideways – up 0.2 percent for the week. Someone is taking advantage of the rally, and exiting.
Risk is elevated.
Currently net short 166k, down 93.4k.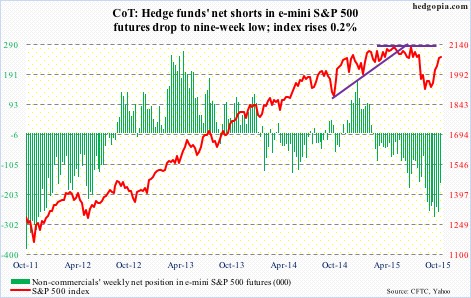
Euro: Last week, thanks to Mario Draghi’s (ECB president) talk of possible announcement of additional stimulus in December, the euro fell three percent, losing both 50- and 200-day moving averages. By Wednesday this week, it was down another 0.9 percent, reacting to the “hawkish” FOMC statement. Buyers showed up near the lower Bollinger band on Thursday.
When it was all said and done, the currency was essentially flat for the week. Daily conditions are oversold, and there is room to rally. However, last week it sliced through trend line support going back to March this year, the underside of which provided resistance on Friday. Before this, rally attempts throughout this year got repelled at 114.50-ish. Euro bulls have their work cut out for themselves.
Currently net short 105.9k, up 43.4k.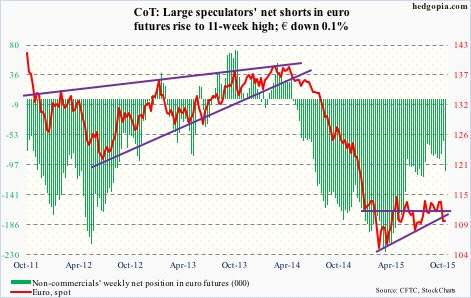
Gold: Immediately after the FOMC statement came out, both gold and equities sold off hard. Equities went on to reverse course and close the session off big, gold stayed down. Apparently, looking at how the short end of the yield curve behaved, how financials and the dollar acted, one would think gold would tag along. Apparently not… this is not supposed to happen if markets were all girding for a hike come December. Which signal should we trust – the dollar or gold?
Regardless, the metal is sitting at 1,140-ish support, which also approximates three-month rising trend line. The latest selling pressure came after gold was unable to take out two-plus-year resistance at 1,180-ish. Weekly overbought conditions have tons of unwinding left still.
Nonetheless, non-commercials continue to add to net longs.
Currently net long 157.4k, up 6.1k.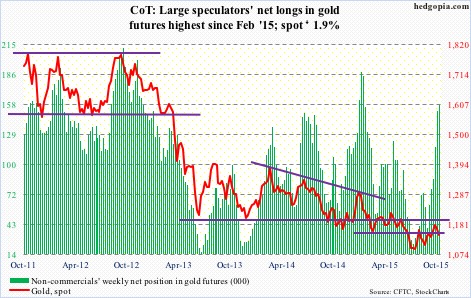
Nasdaq 100 index (mini): On the heels of a 4.2-percent rally last week, the Nasdaq 100 tacked on another 0.5 percent this week. Last week’s big winners continued their run – AMZN up 4.5 percent, GOOGL up 2.5 percent; MSFT, however, gave back hefty gains to end the week down 0.4 percent.
The index has now rallied 23 percent since the August 24th low, to a hair’s breadth away from the July high. Double top or breakout? Time will tell.
One distinct difference this week was that semis were no longer leading. They may very well have peaked. As well, the only major tech company left to report is FB, which reports on Wednesday. So earnings will no longer propel the index higher.
Currently net long 56.8k, up 26.8k.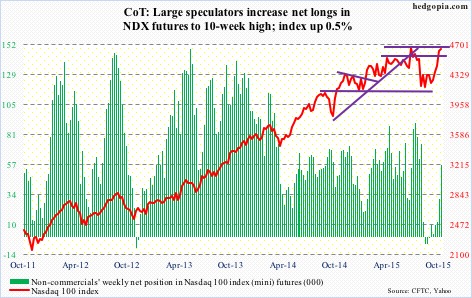
Russell 2000 mini-index: By nature, small- and mid-cap companies tend to be domestically-focused, and they have been lagging large-caps. Big time! Since the September 29th low, the Russell 2000 small cap index is up seven-plus percent. Ditto with the S&P 400 mid cap index.
On Wednesday when most asset classes acted like a December hike was a done deal, the Russell 2000 jumped 2.9 percent, in the process breaking out of two-month resistance at 1170. Rather counterintuitively, the Wednesday action was telling us that higher rates were supposedly good for small-caps. Maybe not.
Come Thursday, the index was back below that support/resistance. A breakout quickly turned into a fake out. The 50-day moving average, which is no longer dropping, is 1.3 percent away. Let us see if buyers show up to defend that support in the coming days.
Incidentally, the daily Bollinger band is tightening. A break is coming, probably to the downside.
Currently net short 41.4k, up 6.9k.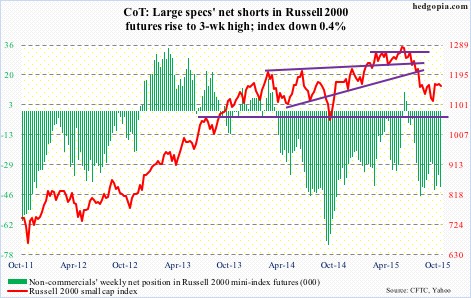
US Dollar Index: Last week, the dollar index poked its head out of a seven-month symmetrical triangle. This week, at one point on Wednesday, aided by the FOMC statement, it was up another 0.7 percent, but was not able to hang on to it, in the end falling 0.2 percent for the week. Either traders’ cooler heads prevailed or it was time for daily overbought conditions to unwind.
The index is less than four percent away from the March high. One common theme in the current earnings season is the lack of revenue growth. Multinationals all blame the strong U.S. dollar. As early as February this year, operating earnings of S&P 500 companies for next year were estimated to be $137.50. This has now been revised downward to $126.96 – still forecast to grow 16.4 percent over this year. Good luck with that – especially if the Fed does indeed raise and the dollar follows suit!
Currently net long 34.7k, up 6.5k.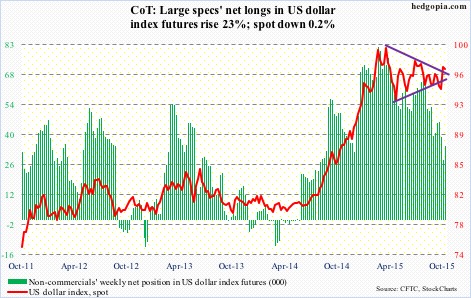
VIX: On Wednesday, spot VIX fell under 13 – first sub-13 reading since August 14th – but closed the session north of 14. The daily Bollinger band is tightening. If a sharp move is coming, then odds favor it is to the upside. But a few things need to happen.
The spot is already at the lower end of its range, and needs to clear the 200-day moving average (16.42; last week was 16.56) for a sustained move higher. The ratio of VIX to VXV has been in the low .80s for three weeks now.
Currently net short 228, up 7.3k.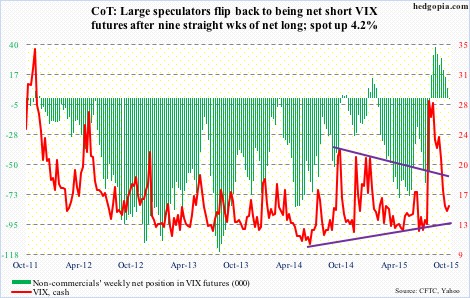
Hedgopia Risk Reward Index