The following are futures positions of non-commercials as of June 7, 2016. Change is week-over-week.
10-year note: The Bank of Korea on Thursday eased its benchmark interest rate by 25 basis points to a record low 1.25 percent. The move was unexpected. It was the BoK’s first rate cut in a year.
Exports make up half of the South Korean economy, and they are slumping, having shrunk for the 17th straight month in May.
It is not just Korea. Every one of the exports-reliant economies is going through a sticky patch.
China’s exports dropped 4.1 percent in May from a year earlier, Japan’s fell 10.1 percent in April, Taiwan’s fell 9.6 percent in May, Hong Kong’s fell 2.3 percent in April, and Germany’s was flat in April, among others.
This is a testament to the prevailing weak end-demand globally.
On Wednesday, the World Bank cut its 2016 global growth forecast to 2.4 percent from 2.9 percent estimated in January. Just this April, the IMF forecast 3.2 percent growth. Things are decelerating.
The World Bank’s forecast for the U.S. this year went from 2.7 percent to 1.9 percent, matching the consensus forecast. The U.S. economy grew 2.4 percent last year.
Amidst this, we have a Fed that is pounding the table telling the markets that it wants to raise rates. It is gotten tougher to differentiate signal from noise.
The FOMC meets next week, on 14-15, and needs to perform a high-wire act – indicate data dependence and at the same time tell the markets it would like to squeeze in a hike come July should the June payroll report cooperate.
Currently net long 15.2k, up 156.2k.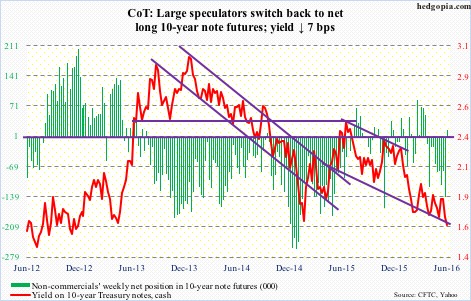
30-year bond: Major economic releases next week are as follows.
The FOMC meeting begins on Tuesday, and concludes the day after.
Also on Wednesday are retail sales (May) and the NFIB small-business optimism index (May).
Retail sales rose 1.3 percent month-over-month in April to a seasonally adjusted annual rate of $453.4 billion. This was the fastest m/m growth rate since March last year. Sales rose three percent annually in April.
Small-business optimism rose a point in April m/m to 93.6. Comp plans fell a point m/m to 15 percent, down from 21 last December. CapX plans were unchanged m/m at 25 percent.
Wednesday brings PPI-FD (May), industrial production (May), and Treasury International Capital (April).
Producer prices rose 0.2 percent in April. Core PPI climbed 0.3 percent. In the 12 months through April, the PPI was unchanged, while core PPI increased 0.9 percent.
Capacity utilization rose 0.6 percent m/m in April to 75.4 percent, but way off the cycle peak 78.9 percent in November 2014. Year-over-year, utilization has contracted for 14 consecutive months.
Foreigners continue to dump U.S. equities. On a 12-month running total basis, March saw sale of $128.4 billion, slight improvement from February’s record sale of $138.9 billion. The last time this metric was positive was February last year.
On Thursday, we get CPI (May) and NAHB housing market index (June).
Consumer prices rose 0.4 percent in April, and core CPI 0.2 percent. In the 12 months through April, the CPI increased 1.1 percent, and core CPI 2.15 percent. This was the sixth straight month core CPI jumped north of two percent y/y.
Builder sentiment has been stuck at 58 the past four months through May. It peaked at 65 last October – a 10-year high.
On Friday, housing starts for May are published. April was up 6.6 percent m/m to a seasonally adjusted annual rate of 1.17 million units, but down from 1.21 million in February.
Currently net long 90.7k, up 26.4k.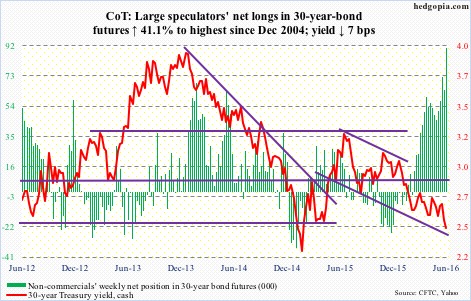
Crude oil: Saudi Arabia Sunday cut its oil prices for July deliveries to Europe. The move comes after OPEC last week failed to reach a deal on production ceiling. The price drop must have surprised many as demand tends to grow in the second half.
The Saudis are probably responding to Iran’s resumption this February of crude exports to the EU. It is a market share issue. Markets pretty much ignored this, but liked what they saw in U.S. crude stockpile.
For the week to June 3rd, U.S. crude inventory dropped by another 3.2 million barrels to 532.5 million barrels. Inventory is now down 10.9 million barrels from the April 29th high of 543.4 million barrels, which was the highest since the all-time high 545.2 million barrels in October 1929.
Crude imports dropped, too – by 134,000 barrels per day to 7.7 million b/d.
Plus, refinery utilization rose to a nine-week high of 90.9 percent.
Other details were not as good.
Gasoline and distillate inventory both rose – the former by one million barrels to 239.6 million barrels and the latter by 1.8 million barrels to 151.4 million barrels. Both are down from recent highs – gasoline from the February 12th high of 258.7 million barrels and distillates from the January 8th high of 165.6 million barrels.
Crude production rose by 10,000 b/d to 8.75 mb/d. This was the first weekly increase in 13 weeks. Production peaked at 9.61 mb/d in the June 5th week last year.
By Wednesday, spot West Texas Intermediate crude had rallied another 5.4 percent, and then dropped hard the next couple of sessions, ending the week flat.
Amidst heavy overbought conditions, the weekly chart produced a shooting star. Daily shorter-term moving averages are now flat to slightly down. Crude wants to go lower.
Currently net long 329.9k, down 33.4k.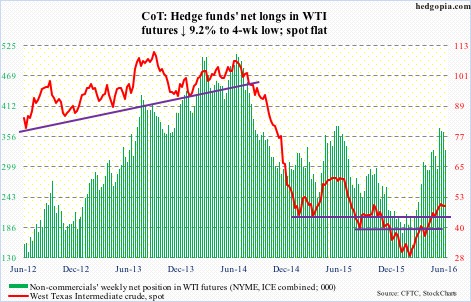
E-mini S&P 500: Shorts keep getting squeezed. During May 13-31, short interest on SPY, the SPDR S&P 500 ETF, dropped 3.4 percent period-over-period to 233.5 million – the lowest since the January 30th period last year. The ETF rallied another 2.5 percent during the period.
Since February 11th when U.S. stocks bottomed, short interest has been a big help. NYSE short interest dropped 8.5 percent during the period. Along with corporate buybacks, this has come at a time when other sources of buying power are not cooperating.
Buybacks were $160.1 billion in 1Q16, second only to $172 billion in 3Q07. The four-quarter rolling total was $588.1 billion, essentially on par with the all-time high of $589.1 billion in 4Q07 (courtesy of S&P). During the quarter, the S&P 500 rose a scant 0.8 percent. NYSE margin debt shrunk by $15 billion, foreigners sold $23 billion worth of U.S. equities (TIC data), and U.S.-based equity funds lost just north of $44 billion (courtesy of Lipper).
Flows continue to disappoint. In the week ended Wednesday, $852 million came out of U.S.-based equity funds. Since the week to February 10th, north of $44 billion has been redeemed (courtesy of Lipper).
In the same week, SPY lost $71.7 million, after having attracted $384.5 million in the prior week (courtesy of ETF.com).
Buybacks have been the lone savior. Importantly, U.S. corporate debt has risen from $6.5 trillion in 2Q09 to $8.3 trillion in 1Q16. And with earnings in deceleration, it is hard to maintain the same level of buybacks.
Up until Thursday, this was the least of bulls’ worries. Amid anemic volume, dips were being bought. Institutions likely were not buying, but were not selling either. That may have changed in the last couple of sessions. Conditions are overbought, with the index losing the 10-day moving average on Friday. The 50-day moving average is less than a percent away… only a matter of time before it gives way.
Currently net short 31.8k, down 76.2k.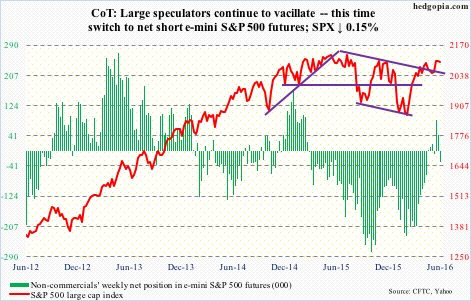
Euro: Eurozone growth for 1Q16 was revised up to 0.6 percent from prior 0.5 percent. The economy grew 1.7 percent year-on-year.
Plus, the ECB began buying corporate bonds, pushing yields lower on several companies’ debt. This is the latest tool the bank has adopted to try to ignite inflation and lower financing costs. Time will tell if it will succeed.
The euro is not exuding much confidence. At least not yet.
On Wednesday, one-plus-year resistance at 114-114.50 was tested again – unsuccessfully. Daily conditions are overbought, and the 50-day moving average is now flat to slightly down.
Currently net short 67.1k, up 29.5k.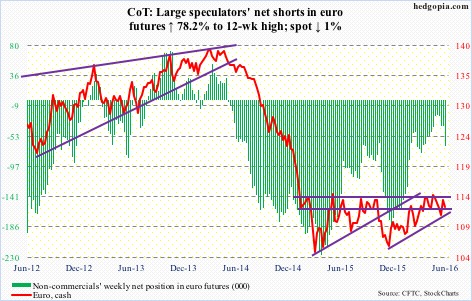
Gold: Spot gold came pretty close to dropping out of a four-month range, but gold bugs stepped up to the challenge.
On May 31st, after a four-week, eight-percent drop, the metal reversed with a hammer session, and was able to further build on it. It rallied 2.4 percent this week, and north of six percent since that low. This probably squeezed more shorts.
Already, during the May 13-31 period, short interest on GLD, the SPDR gold ETF, dropped 14.4 percent period-over-period to 9.7 million – an eight-week low.
In the week ended Wednesday, GLD also attracted $417 million.
With this, the metal is knocking on the upper bound of the afore-mentioned range, with the 50-day moving average now slightly rising.
Non-commercials added a little. Net longs were the highest four weeks ago. The metal will need their support should it be able to break out of the range.
Currently net long 228.6k, up 31.5k.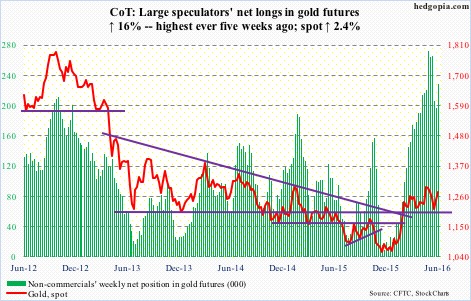
Nasdaq 100 index (mini): Was not able to surpass the April 19th high, and was giving out signs of fatigue before the Friday drop. Last week was a doji. The 10-day moving average has rolled over, and the index already tested the 50-day moving average (on Friday). Plus, the daily MACD is about to flash a bearish crossover.
Flows are drying up.
In the week ended Wednesday, QQQ, the PowerShares Nasdaq 100 ETF, attracted $4.6 million. In the prior two weeks, it pulled in $369 million and $318 million, respectively (courtesy of ETF.com).
Currently net long 62.7k, up 7.8k.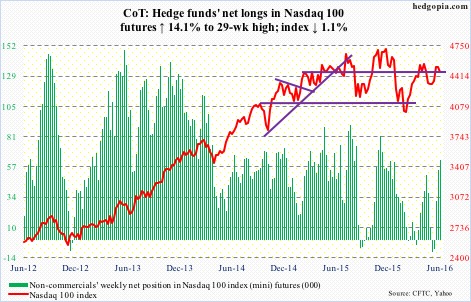
Russell 2000 mini-index: Risk happens fast.
Until Wednesday, of the major U.S. indices, the Russell 2000 was outperforming its peers. It was up 2.2 percent in the week, and came very close to testing resistance at 1200-plus, which goes back to March 2014. Then came the sell-off in the last two sessions, ending the week flat, with a huge gravestone doji… there is more selling to come.
Since the February low, the Russell 2000 has rallied along underneath a broken, but rising, trend line drawn from March 2009, which it has been unable to get past.
In the week ended Wednesday, flows into IWM, the iShares Russell 2000 ETF, trickled down to $14.2 million. This follows more than $1.8 billion in inflows in the prior two weeks (courtesy of ETF.com).
Currently net short 25.1k, down 5.9k.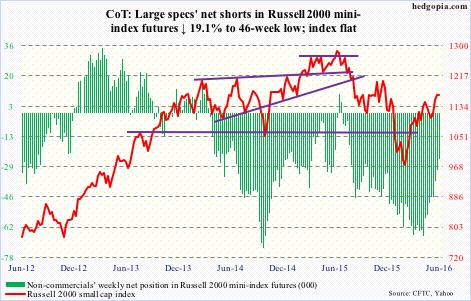
US Dollar Index: Once again approached the lower bound of a one-plus-year range between 100-plus and 93-ish. The support was also tested early May, and was saved.
Thus far, dollar bulls have not succeeded in tempting non-commercials into joining their side. The latter, having pushed net longs to two-year lows, continue to act hesitant.
Currently net long 9.8k, down 107.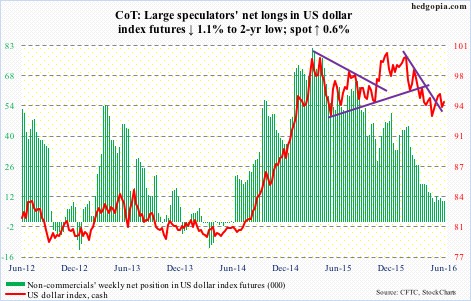
VIX: On Tuesday, spot VIX once again dropped below 13 before rallying off of the lower Bollinger Band.
In all four sessions last week, VIX, which was stuck in a range for three months now, was denied by the 50-day, which it decisively took out this week.
On the weekly chart, it appears a bullish MACD crossover is just a matter of time.
Likewise, the VIX-to-VXV ratio, which languished in oversold zone – high-0.70s to low-0.80s – for 12 weeks, bolted out of it this week and has ways to go before it gets overbought.
Currently net short 103.8k, up 13.5k.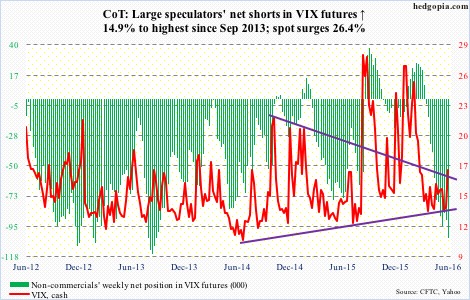
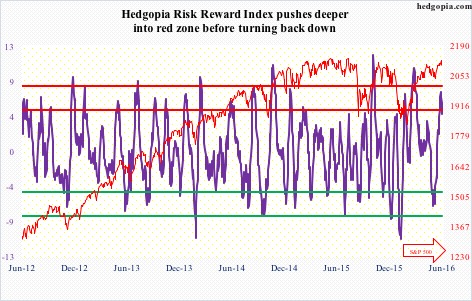
Hedgopia Risk Reward Index