The following are futures positions of non-commercials as of June 21, 2016. Change is week-over-week. (Please note holdings are prior to non-commercials’ potential Friday reaction post-Brexit win.)
10-year note: There goes any sliver of hope for a rate hike in July. The FOMC meets on 26-27 next month. This will be the fifth meeting this year, and there will be three more – September 20-21, November 1-2, and December 13-14.
The July meeting does not have a press conference scheduled. Last December, for the first time in nearly 10 years, the Fed pushed up the fed funds target rate to 0.25 percent to 0.5 percent. When it hikes next – whenever that is – it would likely choose a meeting with scheduled press conference.
The two others with press conference are September and December. The November meeting is right in front of the November 8th U.S. presidential election.
Now, major central banks have to deal with ‘Brexit’, and repercussions emanating from it. So we can all but forget July.
Noticeably, central bankers are dropping hints here and there that they are realizing there are inherent limits to monetary policy. They are increasingly calling for fiscal help – the ECB in particular at the moment.
For entities that did the best they could to neutralize the forces of business cycle, it is probably not a good feeling to realize they are nearing the end of rope.
Currently net long 114.7k, up 69.6k.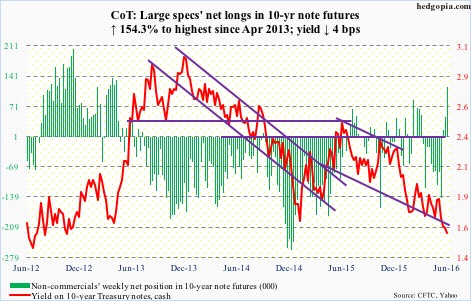
30-year bond: Major economic releases next week are as follows.
On Tuesday, we get GDP (1Q16, third estimate), corporate profits (1Q16, revised estimate), and S&P/Case-Shiller home price index (April).
Real GDP grew 0.8 percent in 1Q16. Post-Great Recession, growth has averaged 2.1 percent – much weaker than the average 3.2 percent going all the way back to 2Q47.
Corporate profits adjusted for inventory and depreciation edged up 0.3 percent sequentially to a seasonally adjusted annual rate of $1.9 trillion. This followed two straight quarters of decline. Plus, profits peaked at $2.16 trillion in 3Q14, and have dropped for three straight quarters annually.
Home prices rose 5.2 percent year-over-year in March, and have increased in the four to five percent range since the middle of 2014 – far ahead of inflation.
Wednesday brings personal income and spending data, and the pending home sales index – both for May.
In the personal income release, all eyes will be focused on y/y change in core PCE inflation. This is the Fed’s favorite measure of inflation, and has remained under two percent growth since May 2012. April rose 1.6 percent.
Pending home sales shot up 5.6 points in April to 116.3. This was the highest since February 2006.
June’s ISM manufacturing index is published on Friday. May edged up five-tenths of a point m/m to 51.3. This follows five straight months of sub-50 reading from October last year to February this year.
Three FOMC members have scheduled appearances, including Janet Yellen, Fed chair, who speaks at 9:30AM Wednesday.
Currently net long 103.5k, up 26.2k.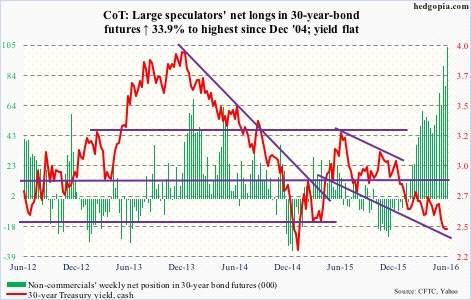
Crude oil: With oil not that far away from $50/barrel, how long before shale oil producers are tempted to increase production? The board rooms of the likes of Hess Corp. (HES), EOG Resources (EOG), Devon Energy (DVN), Marathon Oil (MRO), Continental Resources (CLR), and Anadarko Petroleum (APC), among others, must be grappling with this question.
In many ways, it is a chicken-and-egg problem. With crude having nearly doubled from the February 11th low to the June 9th high, low-cost, but laid-back, producers could very well be leaving money on the table. On the other hand, once production goes up, it can potentially impact price. Particularly so as the busy summer driving season ends.
Thus far, U.S. production has continued to drop, down another 39,000 barrels per day in the week ended June 17. The current rate of 8.7 million b/d is now down nearly one mb/d from the 9.61 mb/d peak in the June 5th week last year.
That said, rig counts, which bottomed at 404 last month, are beginning to inch up. They were 421 this week, down three week-over-week.
This is important as crude inventories continue to remain elevated. Crude oil storage capacity utilization was 73 percent in the week ended June 10 – a record. In the latest week, stocks fell by 917,000 barrels to 530.6 million barrels. They are now down 12.8 million barrels from the April 29th high of 543.4 million barrels, which was the highest since the all-time high 545.2 million barrels in October 1929.
Gasoline and distillate inventories both rose – the former up 627,000 barrels to 237.6 million barrels and the latter up 151,000 barrels to 152.3 million barrels. Distillates were at a six-week high.
On the positive side, refinery utilization rose 1.1 percentage points to 91.3 – an 11-week high.
Crude imports, however, surged 817,000 b/d to 8.4 mb/d – the highest since October 2012.
Last Friday, spot WTI rallied strongly off of its 50-day moving average. This week, it struggled to build on that. In fact, the average was tested again on Friday, and likely loses in the days/weeks ahead.
Shorter-term daily moving averages are now beginning to hook down. After two back-to-back strange weeks – a gravestone doji followed by a dragonfly doji – the week was handed out a 2.6-percent decline.
Currently net long 323.2k, up 9.2k.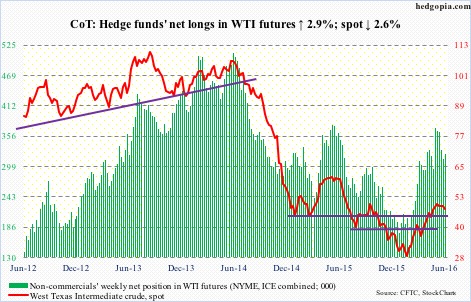
E-mini S&P 500: This was the first test of the 200-day moving average (2021) since March this year, but that took place in overnight futures, not cash. This support also approximates horizontal-line support going back to September 2014. Below, there is another at 1990, which goes back to July 2014.
Whether or not these support levels hold in the days and weeks ahead will be decided, at least in part, by if flows improve. And, of course, if corporate buybacks continue to show aggression. Thus far, flows have utterly disappointed.
In the week ended Wednesday, another $6.1 billion left U.S.-based equity funds. From the week ended February 10th, $53.6 billion has been redeemed.
That said, SPY, the SPDR S&P 500 ETF, in the week ended Wednesday attracted $1.6 billion. This followed inflows of $1.4 billion in the prior week (courtesy of ETF.com). With Friday’s sell-off, this may look entirely different next week.
If there is any consolation in Friday’s trading, it is that weakness in the cash market was nowhere near as bad as in overnight futures. S&P 500 mini futures were down as much as five percent, triggering a circuit breaker. Cash ended the session down 3.6 percent.
Medium- to long-term, multiples are a stumbling block.
Currently net long 54.8k, down 63.4k.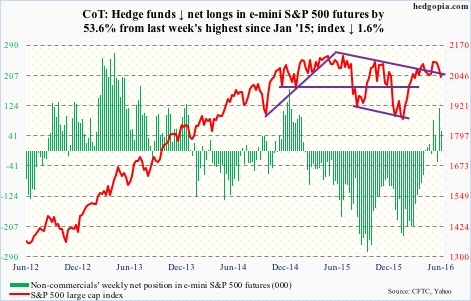
Euro: Markit Eurozone flash PMI fell from 53.1 in May to 52.8 in June – the lowest since January last year. This came out on Thursday. Earlier on Tuesday, the German constitutional court ruled that a legal challenge against the ECB’s OMT (outright monetary transaction), announced in September 2012 and yet to be used, was invalid. In theory at least, the former is euro negative, and the latter positive.
The currency was probably influenced more by technicals than the above news/data. In the first three sessions, it pretty much hugged the 50-day moving average, which is now declining. Then ‘Brexit’ hit, with Friday losing 50-DMA and closing right underneath 200-DMA. Weekly overbought conditions are being unwound, and this probably continues.
Currently net short 61.3k, up 4.9k.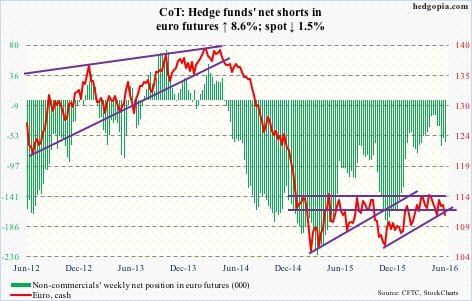
Gold: Gold bugs deserve strong praise!
There was a time when it was beginning to look like spot gold was just unable to break out of a 16-month range, no matter how aggressively non-commercials were adding to net longs (in gold futures) and how much money GLD, the SPDR gold ETF, was attracting.
Net longs are the highest. And, through Wednesday this year, $6.7 billion moved into GLD, with $629 million moving in the week ended Wednesday (courtesy of ETF.com). But the metal only went sideways. In fact, on Thursday last week it suffered a nasty daily ‘shooting star’ reversal (intra-day high of $1,318.9 was the highest since August 2014).
All that changed on Friday. Post-Brexit, the spot surged 8.2 percent before closing up 4.8 percent. The session high $1,362.6 nearly tested $1,381, which is a 38.2 percent retracement of the decline between September 2011 and December 2015. This is an important ratio for Fibonacci fans.
Currently net long 292.7k, up 12.9k.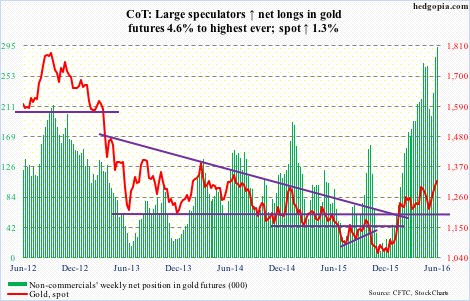
Nasdaq 100 index (mini): In one fell swoop, the Nasdaq 100 is back below 4350 support, which goes back to November 2014.
Truth be told! Off the May lows, the index never got its groove back, with the June 6th high not able to surpass the April 19th high. Nevertheless, the May lows were briefly breached intra-day on Friday, but have held. So we don’t yet have ‘lower highs, lower lows.’
Flows continue to be a suspect. In the week ended Wednesday, QQQ, the PowerShares Nasdaq 100 ETF, lost $338 million. In the prior week, $97.7 million was withdrawn (courtesy of ETF.com).
On the weekly chart, there is now a bearish MACD cross-under.
Currently net long 76.6k, down 6.6k.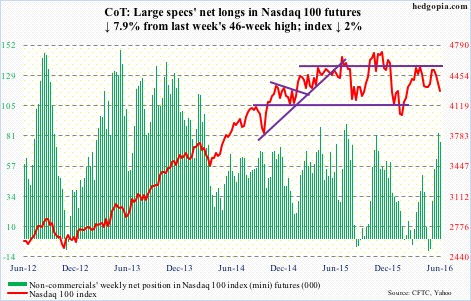
Russell 2000 mini-index: Through Thursday, the Russell 2000 was up 2.4 percent for the week, having recaptured shorter-term moving averages and having successfully defended the 50-day moving average last week. All that positivity changed Friday, with the index collapsing 3.8 percent. With this, it is now stone’s throw away from its 200-day moving average. Will this act as a catalyst for flows into IWM, the iShares Russell 2000 ETF? Remains to be seen.
In the week ended Wednesday, another $266 million left the ETF (courtesy of ETF.com). Last week, it lost $108 million.
Currently net short 19.2k, up 3.7k.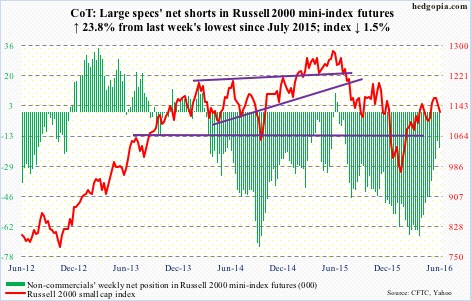
US Dollar Index: In Thursday’s regular session, the dollar index once again approached the lower bound of a one-plus-year range between 100-plus and 93-ish. The support was also tested early May, and held. Ditto this week, with Thursday producing a hammer reversal, right on the lower Bollinger Band.
Come Friday, post-Brexit, it shot up 2.2 percent – to the middle of the afore-mentioned range.
We will find out next week if this was enough for non-commercials to change their hitherto nonchalant attitude toward US dollar index futures. This week, holdings rose a tad from last week’s two-year lows.
Currently net long 9.4k, up 4.7k.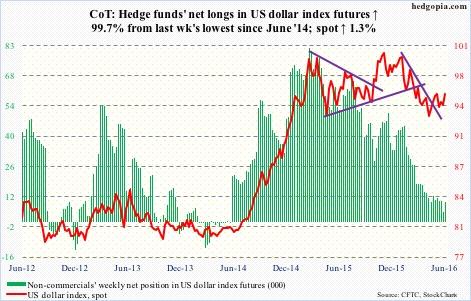
VIX: Volatility bulls nailed it.
Hindsight is always 20/20, but now we know the action in spot VIX early in the week could have been treated as a big tell.
On both Monday and Tuesday, VIX weakness was aggressively bought in the 16-17 range, which the spot broke out of two weeks ago. This was well before the Brexit vote.
Those who bought fear were rewarded as come Friday spot VIX shot up 49.3 percent to 25.76, surpassing the June 16th shooting star high. Inability to exceed that high would have been a big negative.
In the meantime, the VIX-to-VXV ratio surged to 1.076 on Friday, the CBOE put-to-call ratio jumped to 1.01 – first one-plus reading since January 15th this year. Right at this moment, there is tremendous demand for near-term protection, and this will wane – at least near term. Time to be on the lookout for signs of reversal in spot VIX.
Currently net short 45.7k, down 32.7k.
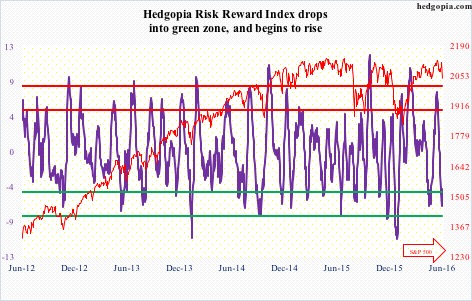
Hedgopia Risk Reward Index