The following are futures positions of non-commercials as of July 12, 2016. Change is week-over-week.
10-year note: TLT, the iShares 20+ year treasury bond ETF, was punished for a 3.6-percent drop this week. This followed a parabolic rally, particularly after it broke out of $133.5-$134 five weeks ago. The weekly chart, grossly overbought, has plenty of downside risk. A breakout retest is possible. The above support also approximates the 50-day moving average.
Should this scenario pan out, 10-year yields (1.59 percent) have room to rise to test its 50-day moving average (1.66 percent). Shorter-term averages in particular are beginning to point up.
Yields dropped to an all-time low 1.34 percent on July 6th.
The bigger question is, was that THE bottom? Possible, but it is probably too soon to declare that. Continuous central-bank activism has managed to patch up holes, but the real problem – which is debt – has not been taken care of. Far from it. In fact, in the developed world in particular, and in China, it has gotten worse post-financial crisis. Who knows how it is all going to shake out?
Currently net long 131.4k, up 35.3k.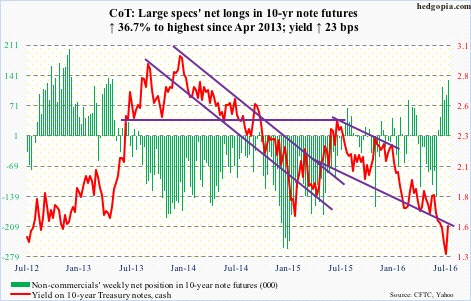
30-year bond: Major economic releases next week are as follows.
Monday brings the NAHB/Wells Fargo housing market index for July. June was 60, up a couple of points month-over-month, but down from 65 last October, which was a 10-year high.
Also on Monday, Treasury International Capital System data is published for May. Notably, global investors continue to avoid U.S. equities, with the 12-month running total in April of minus $135.6 billion. At the same time, also in April, they sold $74.6 billion in U.S. Treasury bonds and notes, with the 12-month running total of minus $65.1 billion.
Housing starts for June come out on Tuesday. May was essentially flat m/m – down 0.3 percent to a seasonally adjusted annual rate of 1.16 million units. Starts reached a cycle peak 1.21 million units in June last year, which was matched this February. That high was the highest since October 2007.
June’s existing home sales are reported on Thursday. May sales rose 1.8 percent m/m to a seasonally adjusted annual rate of 5.53 million units – the highest since 5.79 million units in February 2007. The median price jumped 3.8 percent m/m to a new high $239,700.
Currently net long 103.9k, up 13.8k.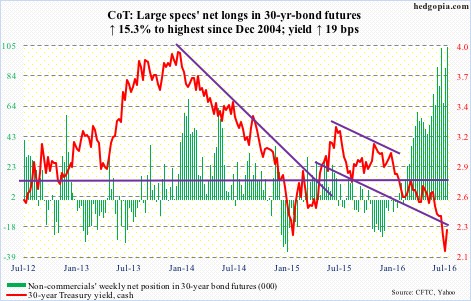
Crude oil: OPEC produced nearly 32.9 million barrels per day in June, up 260,000 b/d from May. Between January and May, production averaged just under 32.6 mb/d. Is OPEC winning the market-share war it initiated in 2014?
In the U.S., for instance, crude production peaked at 9.61 mb/d in the June 5th week last year, and has since dropped by more than a million b/d. In the week ended July 8th, production rose 57,000 b/d to 8.5 million b/d.
In the said week, crude imports dropped 522,000 b/d to 7.8 mb/d.
Crude stocks fell as well, by 2.6 million barrels to 521.8 million barrels. They are now down 21.6 million barrels from the April 29th high of 543.4 million barrels, which was the highest since the all-time high 545.2 million barrels in October 1929.
Gasoline and distillate stocks, however, rose – by 1.2 million barrels and 4.1 million barrels to 240.1 million barrels and 153 million barrels, respectively.
Refinery utilization decreased two-tenths of a point to 92.3 percent.
Bulls must be hoping spot West Texas Intermediate crude is able to stabilize around here. On a daily basis, conditions are oversold. That said, on the weekly chart, there is downside risk still, with support at $42.50-$43.
Currently net long 309.7k, down 8.8k.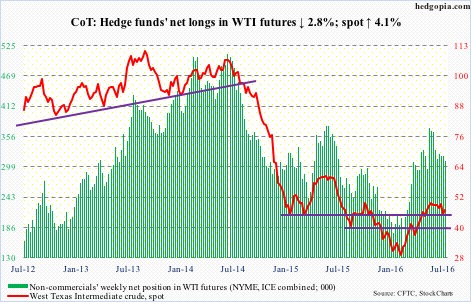
E-mini S&P 500: At long last a breakout! After nearly 16 months of congestion, the S&P 500 pulls one off. If it is a genuine breakout, technicians would be eyeing 2400 in due course. So far so good. The index has pulled 1.3 percent ahead of the breakout point. If the breakout holds next week, all the better.
Curiously, as it turns out, in the June 15-30 period, which was marked by post-Brexit sell-off followed by sharp rally, the index rallied 1.3 percent. Short squeeze was not a factor, as there was not much change in index-level short interest. This may have changed in the current period, though.
Since June 30th through Friday’s high, the S&P 500 rallied 3.3 percent. Shorts who were holding out probably have a reason to rethink.
Particularly so as flows continue. In the week ended Wednesday, another $8.3 billion moved into SPY, the SPDR S&P 500 ETF. In the prior week, $4.6 billion came in (courtesy of ETF.com).
And this. For the first time in 11 weeks, U.S.-based equity funds attracted funds – $7.8 billion (courtesy of Lipper). There is a lot to catch up, though. Since February 10th, $54 billion left these funds.
Currently net long 70.7k, up 30.8k.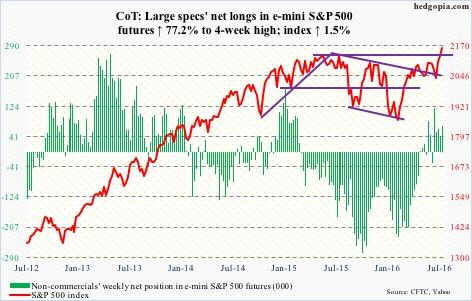
Euro: Eurozone industrial output slumped 1.2 percent in May m/m, although it rose 0.5 percent year-over-year. Production increased 1.4 percent m/m in April.
The euro was indifferent, inching down 0.15 percent for the week.
Next Thursday, the ECB meets. Markets are anticipating further stimulus – or at least some hints – post-Brexit.
The bank is already buying around €80 billion a month of private and public debt, and has cut the benchmark interest rate to a record low of minus 0.4 percent. The balance sheet has grown from €2.04 trillion in September 2014 to €3.13 trillion in June. Hawks will fight tooth and nail against further stimulus.
Currently net short 87.7k, up 12.3k.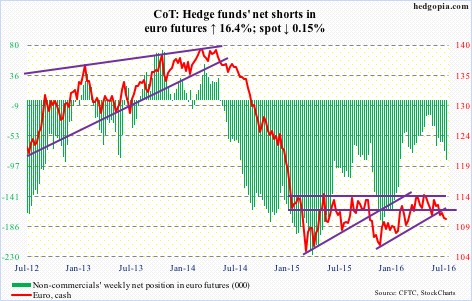
Gold: GLD, the SPDR gold ETF, lost $753 million in the week ended Wednesday. This followed inflows of $1.4 billion each in the prior two weeks (courtesy of ETF.com). The ETF has attracted tons of dough this year – $8.8 billion so far. Through the July 6th intra-day high of $1,377.5, spot gold rallied 30 percent this year.
Hence, gold bugs must be hoping the withdrawal (from GLD) this week is not the beginning of a trend. The afore-mentioned high in spot gold tested – so far unsuccessfully – $1,381, which is a 38.2-percent Fibonacci retracement of the decline between September 2011 and December 2015.
The metal’s breakout retest lies around $1,260-$1,270, which also approximates its 50-day moving average.
Non-commercials cut back net longs six percent from last week’s record high.
Currently net long 297.5k, down 18.5k.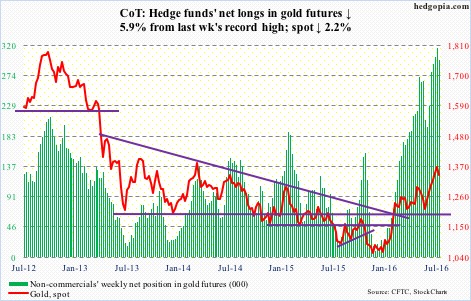
Nasdaq 100 index (mini): Off the June 27th intra-day low through the Thursday high, it rallied north of 10 percent, but still remains north of three percent from the all-time high of last December. In contrast, the S&P 500 and the Dow Industrials have broken out to new highs.
The good thing is, in the week ended Wednesday, QQQ, the PowerShares Nasdaq 100 ETF, attracted $1.2 billion, reversing outflows of $1.1 billion in the prior two weeks (courtesy of ETF.com).
The inflows this week helped the index tack on 1.4 percent, but was marked by two daily dojis. A little fatigue setting in?
Currently net long 72.3k, up 27.7k.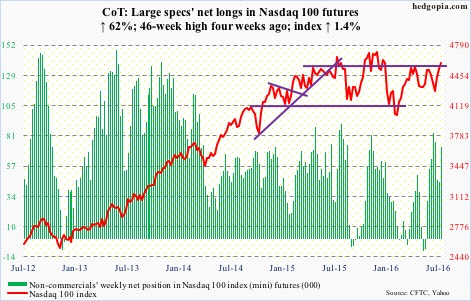
Russell 2000 mini-index: Off the post-Brexit intra-day low on June 27th through the Tuesday high, the Russell 2000 small cap index rallied 11.6 percent. But it was still seven percent from the all-time high of June last year. Even before testing that high lied resistance at just north of 1200, which was tested this Tuesday – so far unsuccessfully.
The $1.9 billion that moved into IWM, the iShares Russell 2000 ETF, in the week ended Wednesday was not enough to push the index past resistance.
Daily momentum indicators are now grossly overbought. Weeklies will soon get there. Bulls’ resolve will be tested in the days to come.
Currently net short 30.2k, down 8.2k.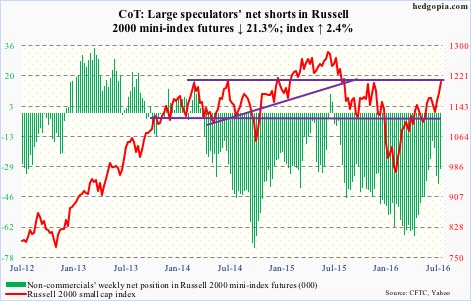
US Dollar Index: Rallied 2.4 percent on June 24th post-Brexit, but was stopped short at its 200-day moving average, which continued to act as a roadblock. It has been 14 sessions since, and still no breakout. On Friday, the index literally closed on that average.
The weekly chart will soon begin to look extended, and daily momentum indicators are beginning to turn lower.
Non-commercials have been gradually adding to net longs in the past month, but there is no aggression.
Currently net long 14k, up 1.7k.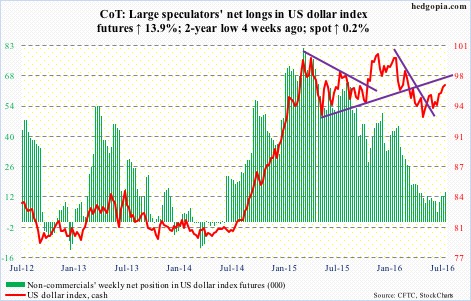
VIX: On Thursday, spot VIX dipped to 12.14 – the lowest since August 5th last year. Once again, it is at/near the bottom of a multi-year range.
In the past, VIX at times has traded sub-11, even sub-10, but from these levels it is safer to bet that the path of least resistance is up, not down. The only question is if it goes sideways or shoots right back up.
Likewise, for the third straight week the VIX-to-VXV ratio remained stuck in oversold territory, dropping below 0.8 this week. Before it began to spike in early June, the ratio stayed oversold for 12 weeks, although there have been plenty of times it has jumped right back up from oversold zone.
Separately, the CBOE put-to-call ratio was in the 0.50s in the past six sessions – the first such occurrence since February last year. Complacent!
Currently net short 57k, up 10.1k.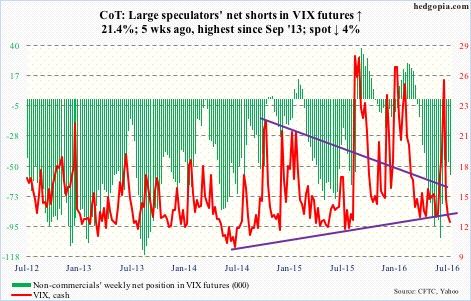
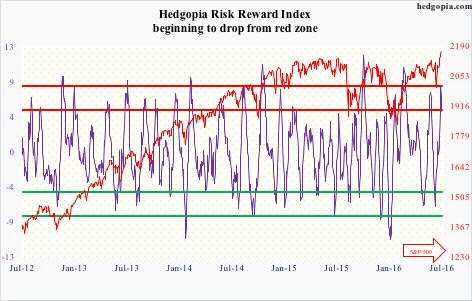
Hedgopia Risk Reward Index