The following are futures positions of non-commercials as of July 26, 2016. Change is week-over-week.
10-year note: The Fed stopped short of signaling a rate hike near term. That said, the statement also said “near-term risks to the economic outlook have diminished.” The usual middle-of-the-road, data-dependent language.
Post-meeting, the two-year Treasury yield – sensitive to Fed policy – fell a couple of basis points to 0.73 percent. Ahead of the meeting, it had risen from 0.56 percent on July 5th to 0.75 percent this Tuesday. For lack of a hawkish message from the Fed, the two-year yield has plenty of room to continue lower near term looking at its daily chart. Ditto with the 10-year.
Currently net long 185.5k, up 76.2k.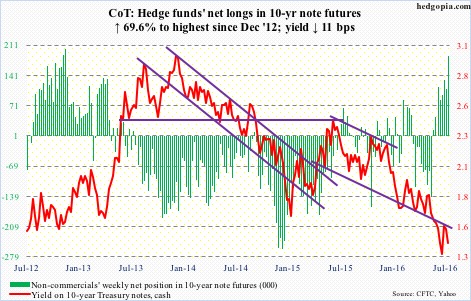
30-year bond: Major economic releases next week are as follows.
Monday brings July’s ISM manufacturing index. June was up 1.9 points month-over-month to 53.2 – the highest since February last year. That is how subdued activity has been of late. Orders rose 1.3 points m/m to 57 – a three-month high.
Personal income and spending for June comes out on Tuesday. Core PCE deflator – the Fed’s favorite measure of consumer inflation – rose 1.62 percent year-over-year in May, faster than 1.58 percent in April, but much higher than 1.26 percent last July. That said, the last time prices rose at two percent was in April 2012.
July’s ISM non-manufacturing index is published on Wednesday. June rose 3.6 points m/m to 56.5 – a seven-month high. Similarly, orders increased 5.7 points to 59.9.
The advance report on durable goods for June was reported this Wednesday. The full report will be published next Thursday. Orders for non-defense capital goods ex-aircraft – proxy for business capex – inched up 0.2 percent in June to $62.3 billion (SAAR) and fell 3.7 percent y/y. This was the eighth straight y/y drop and 17th out of last 18 months.
July’s employment report is on tap for Friday. Non-farm payroll surged 287,000 in June – the highest monthly gain since October last year. The question is, was that a one-month fluke or the beginning of a new trend? The business cycle is getting long in the tooth, so it is hard to bet on the latter. Year-to-date, monthly job creation has averaged 172,000, slower than 229,000 in 2015 and 251,000 in 2014.
Currently net long 97.4k, up 5.6k.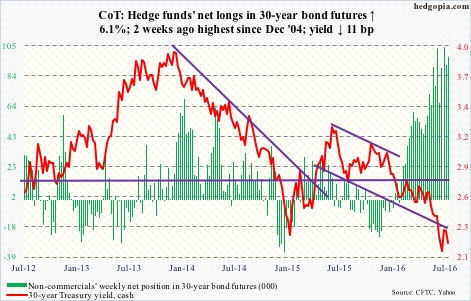
Crude oil: The $42.50-$43/barrel support zone on spot West Texas Intermediate crude was lost. It collapsed 21.5 percent from the high seven weeks ago before finding support at its 200-day moving average. The spot remains oversold on a daily chart. That said, there is a ton of resistance overhead.
From the fundamental perspective, this week was not much help.
In the July 22nd week, crude stocks rose by 1.7 million barrels to 521.1 million barrels. This was the first week-over-week increase in 10 weeks. Stocks are now down 22.3 million barrels from the April 29th high of 543.4 million barrels, which was the highest since the all-time high 545.2 million barrels in October 1929.
Gasoline stocks increased 452,000 barrels to 241.5 million barrels, to a 12-week high.
Distillate stocks fell 780,000 barrels to 152 million barrels, to a three-week low.
Crude stocks jumped 303,000 barrels per day to 8.4 million b/d, matching the high five weeks ago. This was the highest since December 2012.
Crude production rose 21,000 b/d to 8.5 mb/d. This was the third straight weekly increase since production bottomed at 8.43 mb/d. Production is still down big since peaking at 9.61 mb/d in the June 5th week last year.
Refinery utilization fell eight-tenths of a point to 92.4 percent.
Currently net long 274.6k, down 24.7k.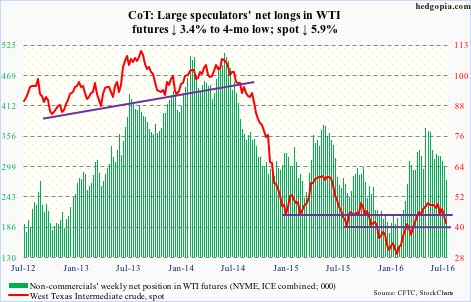
E-mini S&P 500: Short interest on SPY, the SPDR S&P 500 ETF, fell 7.6 percent period-over-period during June 30-July 15; the S&P 500 broke out of 16-month consolidation as well as May 2015 peak to a new high. While the decline in SPY short interest indicates squeeze, on an index level short interest dropped minimally. Shorts are hanging in there. Just looking at flows, they are probably not wrong to do so.
In the week to Wednesday, another $4.1 billion left U.S.-based equity funds (courtesy of Lipper). In the prior week, $2.8 billion was redeemed. Since the week ended June 29th (the S&P 500 reversed on the 27th), $7.3 billion has been withdrawn.
SPY, the SPDR S&P 500 ETF, on the other hand, attracted $2.1 billion in the same week (courtesy of ETF.com). This follows outflows of $1.1 billion in the prior week.
The index continues to remain grossly overbought on a daily basis… and now weekly as well. Shorter-term moving averages are beginning to go flat, and there is now a daily bearish MACD cross. As well, the weekly chart produced a hanging man, warning of a potential trend reversal … needs confirmation.
Currently net long 162.1k, up 15.9k.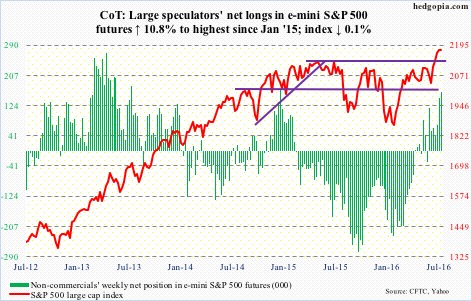
Euro: Lending to Eurozone companies increased 1.7 percent y/y in June, up from a revised 1.6 percent in May. Household lending grew at the same rate.
The euro, oversold, rallied off of its lower Bollinger band, past both its 50- and 200-day moving averages. There is a ton of room for continued unwinding of weekly oversold conditions.
Currently net short 112.6k, up 12.7k.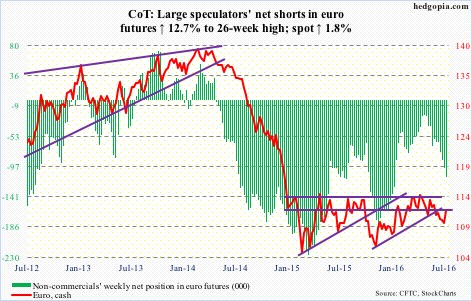
Gold: The 1,300-plus/ounce continued to provide support, which goes back to January 2011. There is likely a tug of war ahead between daily and weekly indicators – the former oversold and the latter overbought.
For the third week running, GLD, the SPDR gold ETF, experienced outflows. In the week ended Wednesday, it lost $465.1 million, coming on the heels of outflows of $754 million in the prior two.
Non-commercials’ net longs reached the highest three weeks ago, and have since been down for three straight weeks.
Currently net long 279k, down 7k.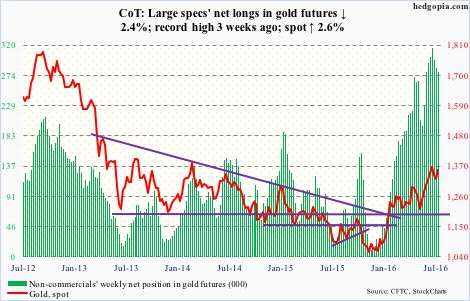
Nasdaq 100 index (mini): A new closing high! Although on an intra-day basis, it is still 1.8 percent from the March 2000 all-time high. Earnings from tech heavyweights helped – results from Apple (AAPL), Facebook (FB), Alphabet (GOOGL), and Amazon (AMZN) were received well.
Flows cooperated as well. QQQ, the PowerShares Nasdaq 100 ETF, pulled in $893.1 million in the week ended Wednesday. In the prior week, $510 million was withdrawn (courtesy of ETF.com).
The index is now up for five straight weeks, with rising volume. That said, earnings tailwind is all but over. And conditions are overbought, with the daily RSI ending the week at 72.31.
Currently net long 120.3k, up 24k.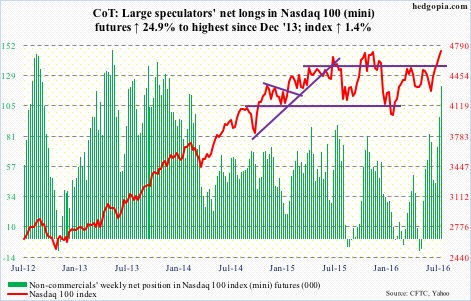
Russell 2000 mini-index: In the week ended Wednesday last week, IWM, the iShares Russell 2000 ETF, lost $221 million (courtesy of ETF.com). This did not help as the Russell 2000 had been hammering at a two-year horizontal-line resistance. This week, another $1.1 billion left the ETF; the Russell 2000 managed to poke its head out of that resistance, but ever so meekly. Flows are not helping.
Small-caps have lagged their large-cap brethren. Unlike the S&P 500 and Dow Industrials, the Russell 2000 is yet to reach a new high. From this standpoint, it is risk-off, as also denoted by persistent decline in margin debt.
Non-commercials, heavily net short three months ago, have been cutting down, helping the index rally. That squeeze tailwind is all but over.
Currently net short 8.2k, down 9.4k.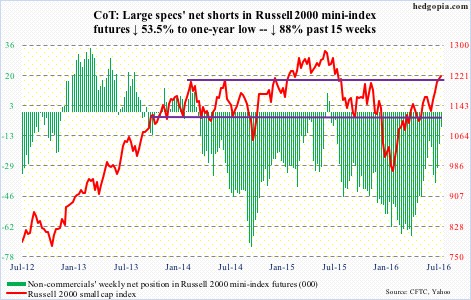
US Dollar Index: On Wednesday came out news that Japan’s Prime Minister Shinzo Abe is set to unveil a surprisingly large ¥28-trillion stimulus package. Two days later, on Friday, the Bank of Japan failed to live up to markets’ unrealistic, lofty expectations. The latter only modestly increased purchases of ETF’s, maintaining its base money target at ¥80-trillion, 0.1-percent negative interest rate, and purchases of other assets. The yen surged.
When it was all said and done, the dollar index shed 2.1 percent for the week, slicing through its 200-day moving average, which it broke out of last week. There is now a daily bearish MACD cross. Weekly momentum indicators are overbought, with tons of room for unwinding.
In the past five weeks, non-commercials’ net longs have gone up more than 13,000 contracts, the dollar index has gone flat.
Currently net long 22.5k, up 8k.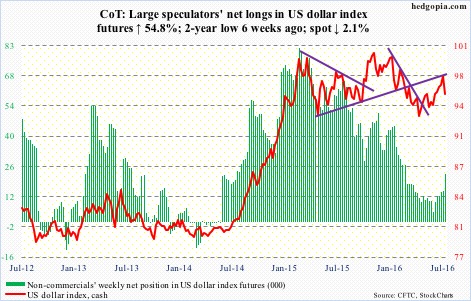
VIX: In the week’s first four sessions, spot VIX would rally to 13.50 or beyond, only to close under 13 in three of the four. While the 10-day moving average provided support, the 20-day vehemently resisted; the former was lost on Friday, dipping below 12.
VIX is at the lower end of range (sub-13 in 11 out of last 12 sessions, sub-12 in three). Bollinger bands continue to narrow, with the lower band having risen to 11.05, and likely to provide support.
The VIX-to-VXV ratio has been in oversold territory the past five weeks, with the last three in the mid to high 0.70s and the first two in the low 0.80s … has a ton of unwinding left.
Currently net short 89k, up 22.3k.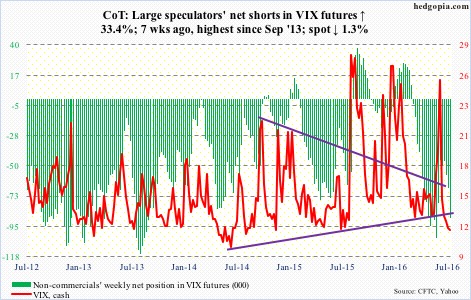
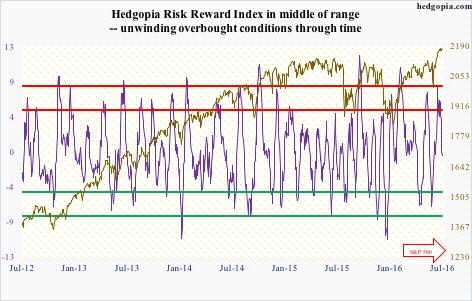
Hedgopia Risk Reward Index