The following are futures positions of non-commercials as of August 30, 2016. Change is week-over-week.
10-year note: Prior to this week, after hawkish comments from several FOMC members, it looked like the August jobs report was the sole make-or-break data point insofar as prospects for a rate hike this month were concerned.
Then came Thursday’s disappointing ISM manufacturing report for August. The main index dropped 3.2 points month-over-month to 49.4 – a seven-month low. Orders dropped 7.8 points m/m to 49.1 – first sub-50 reading since December last year.
The Fed has a mandate of maximum employment and price stability.
August produced lower-than-consensus 151,000 non-farm jobs, although the monthly average in the past three months was 232,000. At first glance, the September 20-21 FOMC meeting may look like a go. But August’s softer jobs plus the ISM report may have given the Fed an excuse not to move. ISM manufacturing does tend to correlate well with GDP.
The next meeting is on November 1-2, and does not have a press conference scheduled, and after that December 13-14, which has one scheduled.
Currently net long 101.5k, up 53.1k.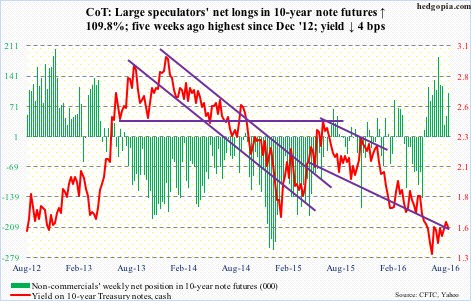
30-year bond: Major economic releases next week are as follows. Monday is closed for Labor Day holiday.
Tuesday brings August’s ISM non-manufacturing index. July dropped a point m/m to 55.5. Orders rose four-tenths of a point to 60.3. Orders have risen from May’s 54.2.
July’s JOLTS are due on Wednesday. Job openings rose by 110,000 m/m in June to a seasonally adjusted annual rate of 5.62 million. Openings peaked at 5.85 million in April this year, just slightly surpassing 5.79 million in July last year.
Consumer credit for July will be published on Thursday. June was $3.63 trillion – up from $2.59 trillion in June 2009, when Great Recession ended.
Two Fed officials are scheduled to speak on weekdays.
Currently net long 28.4k, down 29.3k.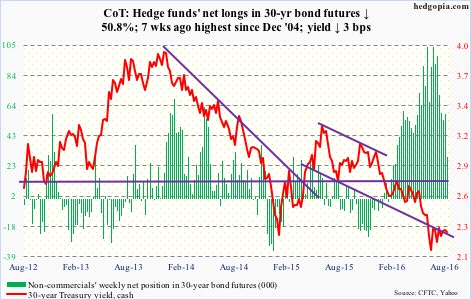
Crude oil: The failure two weeks ago to break out of a potentially bullish reverse head-and-shoulders formation is proving costly for spot West Texas Intermediate crude. After last week’s three-percent drop, it dropped another 6.7 percent this week.
Momentum was already down. Come Wednesday, the spot suffered a daily bearish MACD cross, also losing the declining 50-day moving average. The 200-day – flattish – is 7.9 percent away. Wednesday’s EIA data was not much help.
In the week ended August 26th, crude stocks rose by 2.3 million barrels to 525.9 million barrels – a nine-week high.
Distillate stocks increased by 1.5 million barrels to 154.8 million barrels – a 16-week high.
Crude imports were up 275,000 barrels per day to 8.9 million b/d – the highest since September 14, 2012.
Gasoline stocks, however, fell by 691,000 barrels to 232 million barrels. This was the lowest since January 1st this year.
Refinery utilization rose three-tenths of a point to 92.8 percent.
Last but not the least, crude production fell by 60,000 b/d to 8.49 mb/d. Production peaked at 9.61 mb/d in the June 5th week last year.
Off the August 19th high of $49.36, the spot is now down five points. Support at $43-$43.50 has taken on a new significance. It was defended on Thursday and Friday.
Currently net long 359.3k, down 6.1k.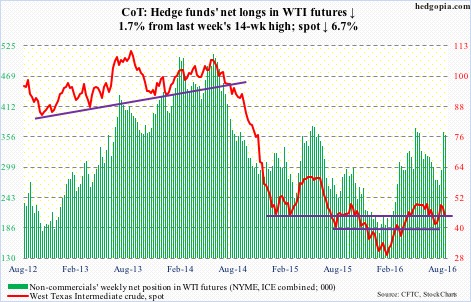
E-mini S&P 500: August saw a first monthly doji on the S&P 500 index (as well as on the Dow Industrials) since November last year. This follows five straight up months since the February bottom, of which July was up 3.6 percent.
Incidentally, NYSE margin debt showed some life in July, rising $27.2 billion m/m to $474.6 billion. Margin debt peaked in April last year at $507.2 billion; in May that year, the S&P 500 peaked. This time around, the index proceeded to score new highs without much help from margin debt.
For that matter, without much cooperation from fund flows as well.
In the week ended Wednesday, another $748 million left U.S.-based equity funds (courtesy of Lipper). Since the week ended February 10th this year, $75 billion has been redeemed.
That said, the persistent trend of outflows seen in these funds is not evident in SPY, the SPDR S&P 500 ETF. After outflows of $1.8 billion in the prior week, it attracted $2.9 billion in the week ended Wednesday (courtesy of ETF.com).
For seven weeks now, the S&P 500 has remained range-bound. Bulls defended 2160 support three times in the past six sessions. Bears will be in better position if they can wrest control of that support.
Currently net long 200.1k, up 7.7k.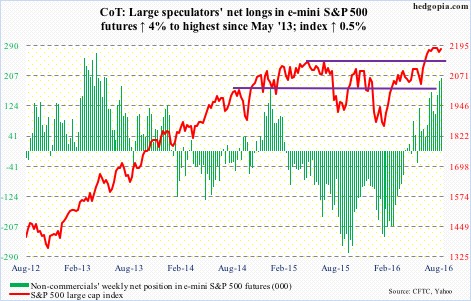
Euro: The European Commission’s economic sentiment indicator for the Eurozone – measures confidence for both consumer and business – fell to 103.5 in August from 104.5 m/m. It was the lowest reading since March. Brexit jitters? More importantly, is that how the ECB, which meets next Thursday, might view this? After all, Eurozone core CPI in August rose a mere 0.8 percent, following a 0.9-percent gain in July.
Regardless, the euro marched to the beat of its own drum – technical drum. Bulls fought hard – and succeeded – not to lose the 50-day moving average.
Currently net short 81.9k, up 5.3k.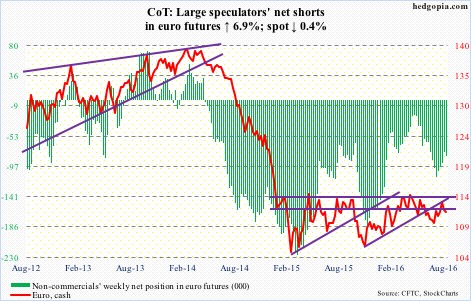
Gold: Gold bugs did step up to defend support at $1,300/ounce, and have an opportunity to push it higher. The metal is oversold on a daily chart, with the price having bounced off the lower Bollinger band.
A lot is going to depend on if GLD, the SPDR gold ETF – and other gold-related ETFs – attract money. In the week ended Wednesday, GLD lost $642 million, after inflows of $26 million in the prior week (courtesy of ETF.com).
Also worth watching is if non-commercials use this as an opportunity to add to their already massive net longs – or at least not begin to cut back. Net longs reached the highest eight weeks ago.
Currently net long 276.3k, down 18.3k.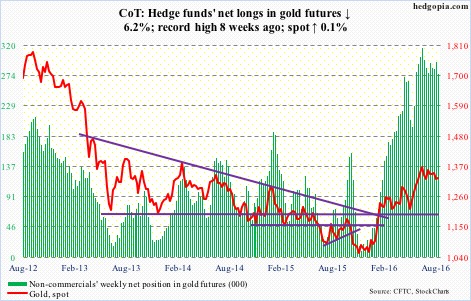
Nasdaq 100 index (mini): The Nasdaq 100 is at a crucial juncture – still above 4700-4750, but showing signs of fatigue.
Mid-week, the 10-day moving average crossed down below the 20-day, but by Friday it was back above it. Bears still have an opportunity to work on this. As do bulls who for now can take advantage of the daily oversold conditions. Should flows cooperate, that is.
In the week ended Wednesday, QQQ, the PowerShares Nasdaq 100 ETF, lost $1.1 billion (courtesy of ETF.com). This followed cumulative inflows of $3.1 billion in the prior five.
Separately, at 48.1 percent, non-commercials’ net longs constituted the highest-ever share of open interest – highly lop-sided.
Currently net long 147k, up 18.9k.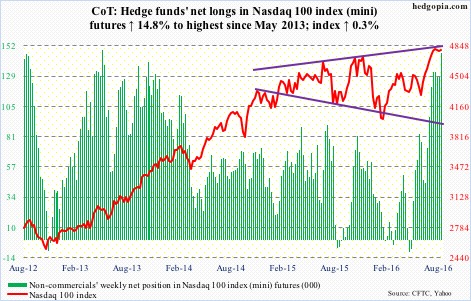
Russell 2000 mini-index: IWM, the iShares Russell 2000 ETF, lost $554 million in the week ended Wednesday, following drawdown of $840 million in the prior week (courtesy of ETF.com). It is possible this changed in the next couple of sessions, as the index rallied 1.9 percent off Thursday’s intra-day low.
It is now 3.5 percent away from its all-time high from June last year.
Currently net long 16k, up 8.9k.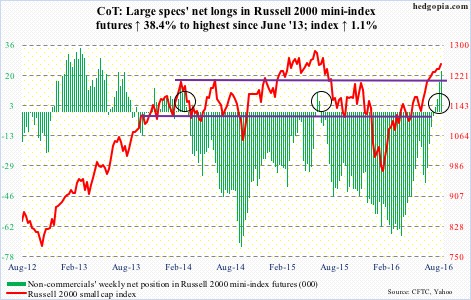
US Dollar Index: Dollar bulls defended the rising trend line drawn from May this year. It will be interesting to see if they will be able to push it toward at least the upper end of the channel, around 98.50. The all-important test, however, lies north of 100 – whenever that is.
Before peaking at 100.71 in March 2015, the dollar index rallied north of 25 percent in nine months. That high was later tested – unsuccessfully – in November that year (100.60). In essence, for the last year and a half the index has been range-bound between 100-plus ad 93-plus.
A breakout is not what the Fed would like to see, as it can have immense repercussions for U.S exports, corporate profits, and what not. A persistently hawkish Fed ensures just that. This very factor probably ensures a breakout does not happen – at least not anytime soon.
This is precisely what is reflected in how non-commercials are positioned. Ms. Yellen’s rather hawkish Jackson Hole speech last Friday was unable to convince these traders to accumulate net longs.
Twice during the week, the dollar index’s rally attempts were repelled by the 200-day moving average. Daily conditions are now overbought.
Currently net long 15k, down 1k.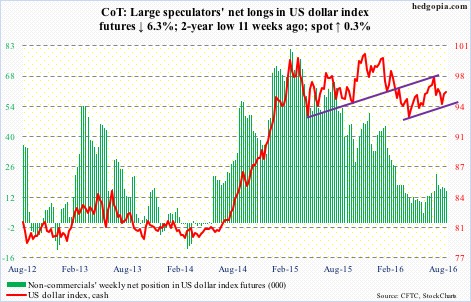
VIX: Intra-day in four sessions this week, spot VIX rallied past its 50-day moving average but was unable to close above it.
Since it peaked on June 27th, anytime spot VIX tried to put in a good session or two, it got smacked left and right. It rallied from just north of 11 two weeks ago to 14.93 last Friday, but has not been able to hang on to the gains.
Consequently, the VIX-to-VXV ratio has languished in oversold territory for 10 weeks now, seven of them in mid- to high-.70s. Form mid-March to end-May this year, it similarly remained oversold for 12 weeks before surging.
Currently net short 127.7k, up 6.2k.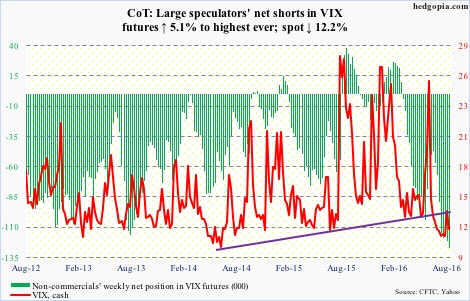
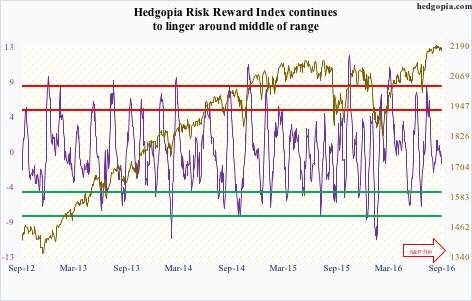
Hedgopia Risk Reward Index