The following are futures positions of non-commercials as of September 13, 2016.
10-year note: More and more, we are beginning to hear from commentators – both professional and in media – that major central banks are increasingly hesitant about adding to stimulus and that they are out of ammunition to shore up the economy. The word stimulus naturally implies unconventional measures such as quantitative easing, negative interest rates and purchases of corporate bonds. The conventional measure of short-term interest rates is already zero-bound.
Last Thursday, going against market expectations, the ECB refused to even suggest if more stimulus was on the way. Next week, the Fed and and the Bank of Japan meet. The latter in particular would probably not add any, the former is even hinting that its next move would be tightening.
Central banks would rather pass the baton to the fiscal side of things. Why this change? Inflation – or a lack thereof.
Years of stimulus have seen central-bank balance sheet balloon – the BoJ, Fed, ECB, and the Bank of England come to mind – yet inflation for the most part is well-behaved. These are also nations with high levels of sovereign debt. A little inflation would go a long way in eroding the value of that debt. But inflation is a no-show. All this extension of central-bank balance sheet has yielded no result.
Currently net long 68.6k, down 36.2k.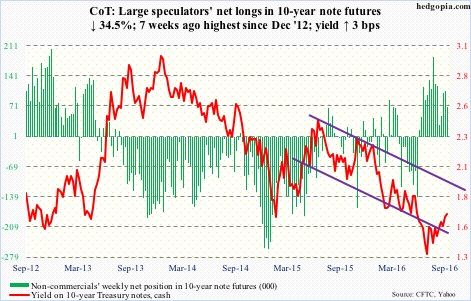
30-year bond: Major economic releases next week are as follows.
The NAHB housing market index for September is published on Monday. August was up two points month-over-month to 60. The index peaked at 65 last October – a 10-year high.
FOMC meeting begins on Tuesday, and concludes the next day. There is a press conference scheduled post-meeting for Janet Yellen, Fed chair. (The BoJ also begins its two-day meeting on Tuesday.)
Also on Tuesday comes out August’s housing starts. They rose 2.1 percent m/m in July to a seasonally adjusted annual rate of 1.21 million units, matching cycle highs of February 2016 and June 2015.
August’s existing home sales are reported on Thursday. July was down 3.2 percent m/m to a seasonally adjusted annual rate of 5.39 million units. June’s 5.57 million units were the highest since 5.79 million in February 2007.
Currently net long 7.8k, down 16.3k.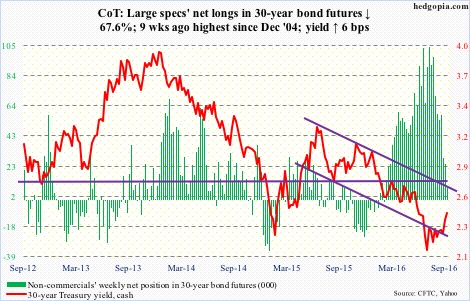
Crude oil: The International Energy Agency cut its global oil demand forecast by about 100,000 barrels per day for this year, to 1.3 million b/d. Next year, it sees demand rising 1.2 mb/d, down 200,000 b/d from prior forecast. Wobbling demand in China and India was primarily blamed.
For the most part, the weekly EIA data added salt to injury.
In the week ended September 9th, crude stocks fell by 559,000 barrels to 510.8 million barrels – the lowest since February 26th this year.
Gasoline stocks, however, jumped 567,000 barrels to 228.4 million barrels, and distillate inventory increased 4.6 million barrels to 162.8 million barrels. The latter was the highest since April 8th this year.
Crude imports rose by 993,000 barrels per day to 8.1 million b/d, reversing half of the 1.8-mb/d decline in the previous week, which was probably influenced by hurricane Hermine.
Crude production rose by 35,000 b/d to 8.5 mb/d – a three-week high. Production peaked at 9.61 mb/d in the June 5th week last year.
Refinery utilization dropped eight-tenths of a point to 92.9 percent.
Once again, spot West Texas Intermediate crude is testing support at $43-$43.50, which was defended early this month. It has lost the 50-day moving average, which is now dropping.
Since the crude peaked on June 9th at $51.67/barrel, it has been making lower highs. The August 3rd low of $39.19 has taken on a new significance.
Currently net long 317.5k, up 19.2k.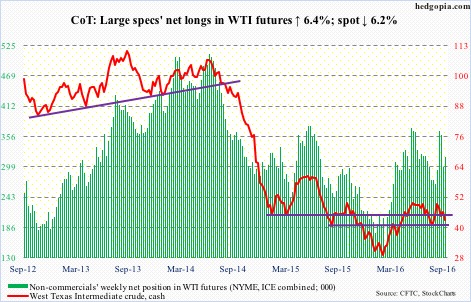
E-mini S&P 500: Last week, selling accelerated when the S&P 500 index lost 2160. This week, buyers showed up near 2120 in all of the first four sessions.
The index peaked at 2134.72 in May last year, and had essentially been going sideways since February that year, when it first hit 2119.59. Hence the significance of 2120. Should the bulls not be able to defend this support, selling is bound to accelerate again.
So far, so good. The index tacked on 0.5 percent this week, but closed off the highs.
Resistance is heavy in the 2160-2178 range, including the 50-day moving average (2168). Weekly indicators remain overbought, but the index is oversold on a daily basis.
It all boils down to flows.
The week ended Wednesday saw SPY, the SPDR S&P 500 ETF, losing $3.4 billion (courtesy of ETF.com), but it is possible this changed Thursday … and needs to if daily oversold conditions were to unwind.
In the same week, U.S.-based equity funds lost a massive $14.4 billion (courtesy of Lipper). Since the February 10th week this year, $90 billion has been redeemed. The S&P 500 bottomed early February, then rallying 21 percent.
Currently net long 93.5k, down 90.1k.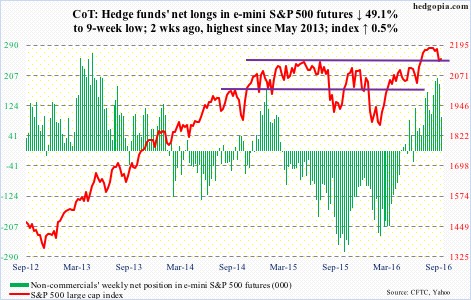
Euro: Eurozone industrial output fell in July – by 1.1 percent m/m and 0.5 percent y/y. The economy grew 0.3 percent in 2Q16, down from 0.5 percent in 1Q; 3Q16 is nearly done, but growth likely has weakened further.
In its latest meeting, the ECB did not act … rather disappointed the markets by at least not extending the current €80-billion/month asset purchases beyond next March.
The euro acts like it is clueless what to make of it, and what to pivot off of. It’s 0.14 percent away from its 200-day moving average.
Currently net short 81.5k, down 11.2k.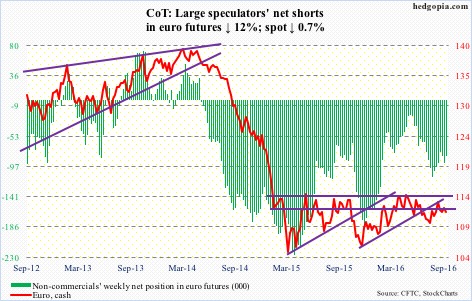
Gold: Notwithstanding if the Fed moves next week, or in December or if ever, or if the dollar rallies or weakens, one thing that is certain to impact gold’s price is flows, or a lack thereof, into gold ETFs. These have proven to be popular vehicles for those seeking exposure to the metal.
In the week ended Wednesday, GLD, the SPDR gold ETF, lost $702 million (courtesy of ETF.com).
Spot gold bottomed at $1045.4/ounce on December 3rd last year. Since then, GLD has attracted $7.7 billion. Since the metal peaked on July 6th at $1,377.5, it has essentially gone sideways to slightly down.
The metal is once again testing support at $1,300, which has been tested several times in the past three months.
Currently net long 285.4k, down 22.4k.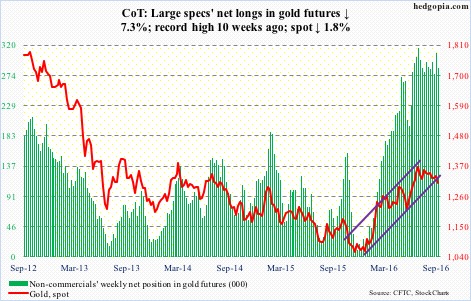
Nasdaq 100 index (mini): Apple (AAPL) constitutes 10.5 percent of the Nasdaq 100. It rallied 11.4 percent for the week, almost single-handedly carrying the index, which was up 2.9 percent. Microsoft (MSFT), Amazon (AMZN), Alphabet (GOOGL) and Facebook (FB) all rallied, but less than the index did.
Last week’s bearish engulfing candle was all but negated. The index is once again knocking on 4840, which in the past month repelled rally attempts three times … should be an important breakout near-term should it happen. Medium-term, the index is vulnerable.
In the week ended Wednesday, QQQ, the PowerShares Nasdaq 100 ETF, continued to suffer outflows, losing $1.7 billion, following outflows of $1.4 billion in the prior two (courtesy of ETF.com).
Currently net long 96.2k, down 47.6k.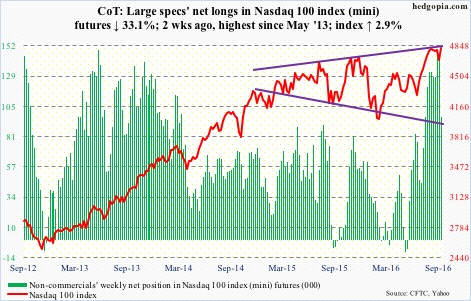
Russell 2000 mini-index: On Tuesday, the Russell 2000 declined 1.9 percent, and that weakness was used as an opportunity to go long. IWM, the iShares Russell 2000 ETF, attracted $1.1 billion in that session (courtesy of ETF.com). For the week ended Wednesday, $579 came in. So far, this has been a smart trade.
The Tuesday low was also a successful breakout retest. In late July, the Russell 2000 broke out of horizontal-line resistance going back to March 2014.
Weekly indicators are overbought, but has room to rally on a daily basis.
Currently net long 8.2k, down 15.1k.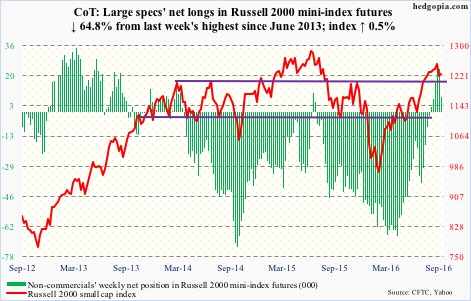
US Dollar Index: The May 2016 rising channel on spot US dollar index is intact. Ahead of next week’s FOMC meeting, the dollar index was directionless for most of the week but rallied 0.8 percent on Friday to just below its 200-day moving average.
Non-commercials have not bought into recent uptick in rate-hike talk, and have been vindicated by data, including this week’s weaker-than-expected retail sales and industrial production/capacity utilization.
Currently net long 17.1k, up 113.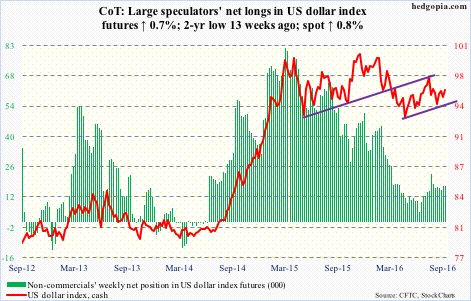
VIX: Spot VIX spiked to 20.51 on Monday before reversing hard to close in the red. That likely is a spike reversal. The spot, overbought on a daily basis, has room to head lower near-term.
Also using Monday’s intra-day highs, the VIX-to-VXV ratio spiked to 1.07. Prior to this, the ratio languished in oversold territory for nearly 10 weeks.
That said, medium-term, volatility is probably not done rallying. There is just too much betting on continued volatility compression.
End-August short interest in VXX, the iPath S&P 500 VIX short-term futures ETN, dropped 4.8 percent period-over-period, but the mid-August reading of 32.6 million was the highest ever.
Non-commercials reduced net shorts 16 percent week-over-week but the prior week was the highest ever.
Currently net short 112.9k, down 20.9k.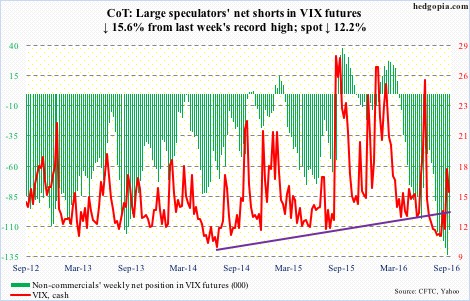
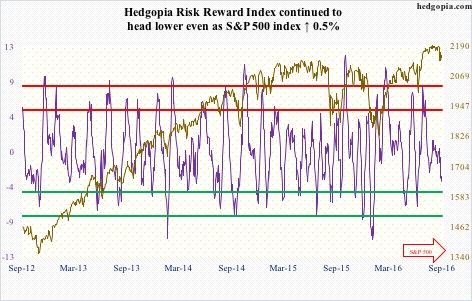
Hedgopia Risk Reward Index