Following futures positions of non-commercials are as of January 3, 2017.
10-year note: Tuesday brought December’s ISM manufacturing index, which rose 1.5 points month-over-month to a two-year high 54.7; orders jumped 6.8 points m/m to a 25-month high. Ten-year yields in that session initially rallied seven basis points to 2.52 percent, but ended up closing essentially flat. There is now a cross-under between 10- and 20-day moving averages.
In the meantime, TLT, the iShares 20+ year Treasury bond ETF, Tuesday found support at its 10- and 20-day, rallying 0.4 percent. A bullish crossover has developed.
Tuesday’s message is loud and clear – bonds getting bought on strong economic data. The long end of the curve probably already priced this in. The 10-year bottomed at a historic low of 1.34 percent on July 6. From that low through 2.62 percent on December 15, yields expanded by 128 basis points – and by 80 basis points post-election through that high.
It was a matter of time fatigue would set in. On the monthly chart, December produced what looks like a gravestone doji on the 10-year (2.42 percent). There is now room to rally on the daily chart, with resistance at 2.45 percent.
Non-commercials could prove to be the biggest wildcard. They have built the most net shorts ever, which, when unwound, is bound to put downward pressure on yields.
Currently net short 344.9k, up 3.9k.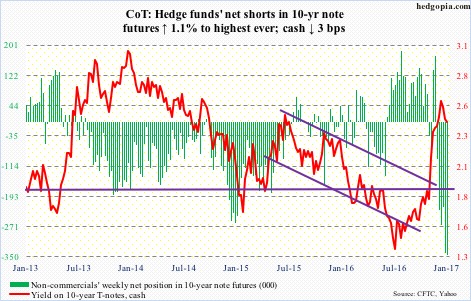
30-year bond: Major economic releases next week are as follows.
Tuesday brings the NFIB small business optimism index (December) and JOLTS (November).
Small-business optimism jumped 3.5 points m/m in November to 98.4, which was the highest since the cycle high 100.3 in December 2014.
Non-farm job openings in October fell 97,000 m/m to a seasonally adjusted 5.53 million. The cycle high 5.85 million was reached in last April – essentially flat with 5.79 million in July 2015 and 5.83 million last July.
On Friday, PPI-FD (December), retail sales (December), and the University of Michigan’s consumer sentiment index (January, preliminary) are scheduled.
Producer prices (final demand) advanced 0.4 percent m/m in November, and 1.3 percent in the 12 months through November. Core PPI increased 0.2 percent, and 1.8 percent in the 12 months through November.
Retail sales in December inched up 0.08 percent m/m to a seasonally adjusted annual rate of $465.5 billion. Sales increased 3.8 percent year-over-year.
December consumer sentiment jumped 4.4 points m/m to 98.2. This was the highest since 103.8 in January 2004.
Currently net short 32.2k, up 10.6k.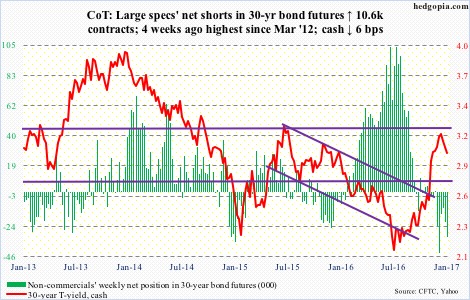
Crude oil: Spot West Texas Intermediate crude began 2017’s first regular session with a bang, only to end with a whimper. At one point on Tuesday, the crude was up as much as 2.8 percent to $55.24 – the highest since July 2015 – but closed the session lower 2.6 percent, in the process producing a massive outside reversal candle. In the next three sessions, oil rallied to offset that decline. Bulls continue to defend $52.
That said, risk/reward odds favor weaker price in the weeks ahead. On the weekly chart, the cash has produced dojis for the five straight sessions, with not much progress in the past four.
The EIA report this week was a mix of both good and bad.
Crude stocks fell by 7.1 million barrels to 479 million barrels – a 10-week low. Crude imports fell, too, by 984,000 barrels per day to 7.2 million b/d – also a 10-week low.
Refinery utilization rose a point to 92, matching the reading of mid-September last year. However, gasoline stocks jumped 8.3 million barrels to 235.5 million barrels – the highest since late July last year. And, distillate stocks jumped 10.1 million barrels to a 14-week high of 161.7 million barrels.
Crude production rose a tad, up 4,000 b/d to 8.8 mb/d.
Currently net long 431k, down 8.2k.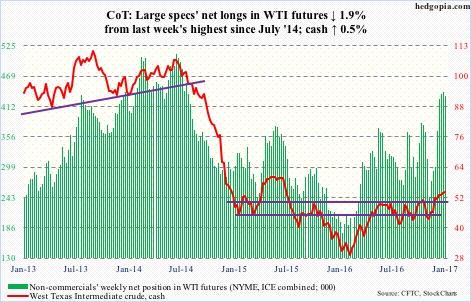
E-mini S&P 500: Year 2017 got off to a rousing start!
Bulls rallied the cash 1.4 percent in the first two sessions – and up 1.7 percent in the opening week – in the process also recapturing the 10- and 20-day moving averages, which were lost in the last three sessions of 2016. On Friday, a new all-time high of 2282.1 was scored, with a close right on resistance.
Even if a breakout occurs, building on that will probably not be easy. Sentiment readings are effusive.
The NAAIM exposure index, which represents the average exposure to U.S. equity markets of its members, exceeded 100 in three out of four weeks in December, and the other three in the past six weeks were in the ‘90s.
Separately, Investor Intelligence bulls have exceeded 50 for eight straight weeks, with the reading this week north of 60. The bull-to-bear ratio has been north of three for five straight weeks. These are not normal readings.
Thus far, flows are cooperating. In the week ended Wednesday, SPY, the SPDR S&P 500 ETF, attracted $3.1 billion. Post-election, $23.1 billion moved into the ETF (courtesy of ETF.com). In the same week, $2.4 billion moved into U.S.-based equity funds – $20.8 billion post-election (courtesy of Lipper).
As long as this continues, overbought does not mean a thing. But this is also a time to be on the lookout for reversal signs. Daily Bollinger bands on the cash have continued to narrow.
Currently net long 81.4k, up 71.7k.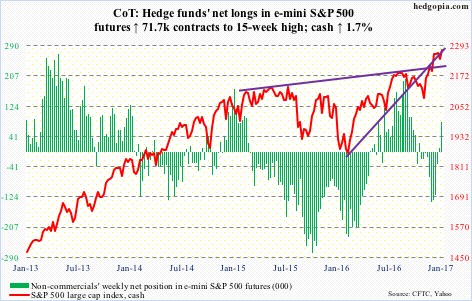
Euro: Eurozone flash CPI rose by a higher-than-expected 1.1 percent in December. Consumer prices advanced 0.6 percent in November. The currency essentially yawned in that session. Inflation is still below the ECB’s goal of below, but close to, two percent.
Right here and now, should spot euro rally, technicals probably play a bigger role.
Three weeks ago, the euro lost horizontal support going back to March last year, followed by sideways action and damage repair. On Thursday, the currency rallied past broken support-turned-resistance at 105-plus. Friday tried to build on this, rallying a tad to 106.21, but ended down 0.7 percent to 105.33. Either this support or 10- and 20-day averages, which are slightly below, need to hold.
Currently net short 70.1k, up 648.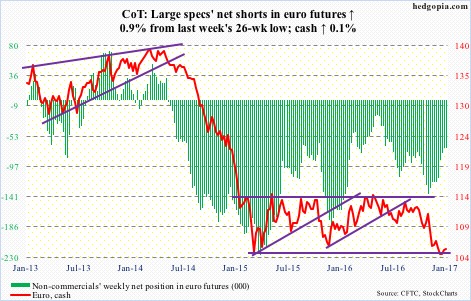
Gold: In the week ended Wednesday, GLD, the SPDR gold ETF, continued to see outflows, losing $353 million. This was the eighth straight weekly loss, totaling $5.4 billion in outflows (courtesy of ETF.com). Spot gold ($1,173.4/ounce), however, rallied in the past couple of weeks.
The metal is showing nice price action of late, and closed the week right on support. Another support zone lies 20 points lower. Resistance lies at $1,200, which also approximates the 50-day moving average ($1,199.09).
Currently net long 96.6k, down 1.8k.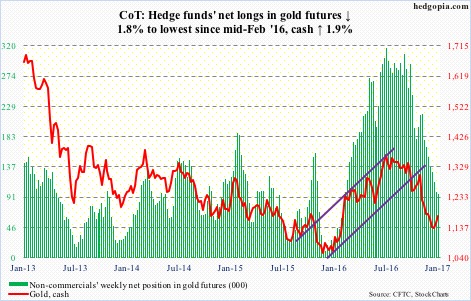
Nasdaq 100 index (mini): No sooner did the cash lose the 10- and 20-day moving averages than they were recaptured – lost in the last three sessions of 2016 and reclaimed in the first two of 2017. The index followed this up with a new intra-day high of 5020.7 on Friday.
Flows were a disappointment, though.
In the week ended Wednesday, QQQ, the PowerShares Nasdaq 100 ETF, saw outflows of $799 million (courtesy of ETF.com). This followed inflows of $3.4 billion in the last three, during which the Nasdaq 100/ETF essentially went nowhere.
Currently net long 73.7k, down 9. 8k.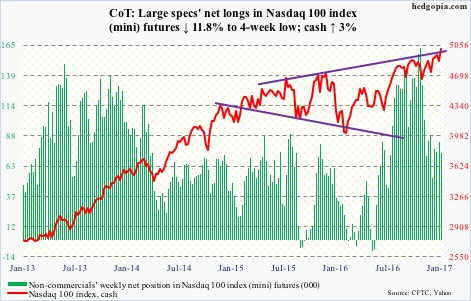
Russell 2000 mini-index: In the final three sessions last week, the cash lost both 10- and 20-day moving averages. Plus, since peaking at 1392.71 on December 9, it had been trading along a slightly declining trend line. It seemed it was just a matter of time before near-term support at 1350-plus gave away. That was not to be.
In the first two trading sessions of 2017, bids showed up again near that support, with Wednesday rallying 1.6 percent, reclaiming the afore-mentioned averages, and closing right underneath the all-time high. There was no follow-through on Thursday, dropping 1.2 percent, and another 0.3 percent on Friday.
In the week ended Wednesday, $823 million moved into IWM, the iShares Russell 2000 ETF – and a cumulative $1.7 billion in the last four (courtesy of ETF.com). The problem is, the ETF has gone nowhere during the period.
Speaking of which non-commercials have amassed net longs up to the gills – sideways at 90,000-plus for three successive weeks. The cash is only trading water. Watch out when these traders go the other way.
Currently net long 92.7k, up 1.3k.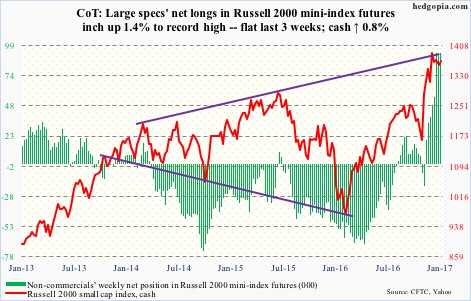
US Dollar Index: The cash finally gave way, but dollar bulls are not willing to give in that easy.
After going sideways for 13 straight sessions above 102, that support was lost on Thursday when it dropped 1.2 percent, also losing shorter-term moving averages in the process. On Friday, it rallied 0.7 percent to end the session at 102.21.
The next battle will be fought around support at 100.7, or thereabouts, which goes back to March 2015. This was a major breakout last November, and now also approximates the 50-day moving average (100.79).
The weekly chart remains extended.
Currently net long 54.3k, up 1.6k.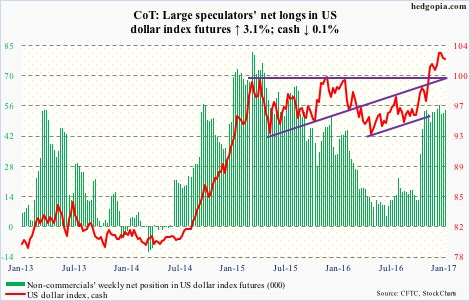
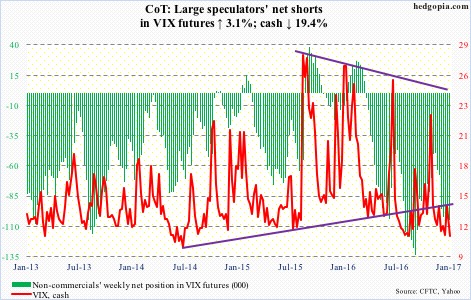
VIX: Last week, spot VIX tried to unsuccessfully take out its 200-day moving average, closing right on the 50-day. By that time, it was beginning to look extended on the daily chart – which got unwound as soon as 2017 got underway. Intra-day, it dropped 3.7 points in five sessions, going sub-11 again.
Also last week, after three successive sub-.8 readings – and in four out of five – the VIX-to-VXV ratio rose to .85, only to see it decline to 0.78 this week.
Importantly on spot VIX, a bullish 10/20 crossover (daily) is likely in the making.
Currently net short 104.6k, up 3.1k.