Following futures positions of non-commercials are as of January 24, 2017.
10-year note: Yields (cash) rose 14 basis points for the week to 2.48 percent, having risen as high as 2.56 percent intra-day Thursday. Earlier, they bottomed at 2.31 percent two weeks ago near the 50-day moving average. That was the week non-commercials’ net shorts in 10-year note futures peaked at a record 394,689 contracts.
The question at the time was, would these traders take advantage of the backup in yields? They did indeed. In the past couple of weeks, holdings have gone down by just under 25 percent, but still remain massive. Continued unwinding of these puts downward pressure on yields.
Thus far, on the daily chart – now overbought – yields forged a lower high on January 26 versus December 15. Plus, unlike two weeks ago, the 50-day, still rising, gets tested at 2.43 percent, raising the odds of a break at some point.
Currently net short 297.2k, down 78.6k.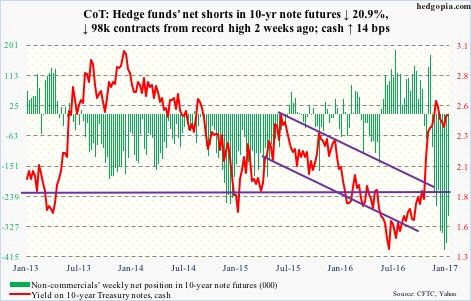
30-year bond: Major economic releases next week are as follows.
Monday brings personal income and pending home sales (both for December).
Core personal consumption expenditures (PCE) – the Fed’s favorite measure of consumer inflation – rose 1.65 percent year-over-year in November. The last time it increased at north of two percent was in April 2012.
Pending home sales fell 2.7 points m/m in November to 107.3. The cycle high 115 was reached last April, which was the highest since 115.4 in March 2006.
FOMC meeting – the year’s first – begins Tuesday and ends on Wednesday.
Also on Wednesday come out the employment cost index (4Q16) and the S&P Corelogic Case-Shiller housing market index (November).
Private-sector compensation costs rose 2.3 percent y/y in 3Q16 – 2nd consecutive two-plus percent rise after four sub-two percent increase in a row.
Nationally, home prices rose 5.6 percent y/y in October – matching the growth rate of July 2014.
January’s ISM manufacturing index is published on Wednesday. December was up 1.5 points m/m to a two-year high 54.7. Orders jumped 6.8 points m/m to 60.2 – the highest since November 2014.
Productivity for 4Q16 is due out on Thursday. Non-farm output per hour rose at an annual rate of 3.1 percent in 3Q16. This followed three straight quarterly decline.
Employment (January), durable goods (December, final), and the ISM non-manufacturing index (Jan) are published on Friday.
December added 156,000 non-farm jobs, for a monthly average of 180,000 in 2016 – lower than 229,000 in 2015 and 251,000 in 2014.
Preliminarily, non-defense capital goods ex-aircraft – proxy for business capital expenditures – rose 2.8 percent y/y in December to a seasonally adjusted annual rate of $64.5 billion. This was the first y/y increase in 14 quarters. Orders peaked at $70.7 billion in September 2014.
Non-manufacturing activity was unchanged at 57.2 in December. This was the highest since 58.3 in October 2015. Services orders were up 4.6 points m/m to 61.6 – the highest since 62.1 in August 2015.
Currently net short 33.7k, up 11k.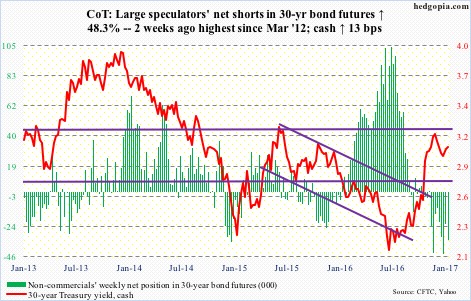
Crude oil: Except for U.S. crude imports, which dropped 568,000 barrels per day to 7.8 million b/d, other major metrics in the weekly EIA report all leaned negative.
For the week of January 20, crude stocks rose 2.8 million barrels to 488.3 million barrels – a nine-week high. Gasoline stocks jumped 6.8 million barrels to 253.2 million barrels – the highest since February last year. And, distillate stocks were up 76,000 barrels to 169.1 million barrels.
Refinery utilization fell 2.4 percentage points to 88.3. Two weeks ago (93.6) was a four-month high.
Crude production inched up 17,000 b/d to 8.96 million barrels. This was the highest since April last year.
Wednesday, the day the EIA report came out, spot West Texas Intermediate crude fell, as did Monday. On Sunday news out that OPEC and non-OPEC producers had taken 1.5 million barrels per day out of the market. They had earlier agreed to output cut of 1.8 mb/d in the first half this year. Ideally, oil should have rallied on this.
From the February (2016) lows, spot WTI more than doubled, and looks fatigued. This week produced another doji – seventh in the last eight weeks.
In the meantime, non-commercials’ net longs rose to the highest since June 2014. Oil began a nasty drop in that month.
Currently net long 507.3k, up 19.6k.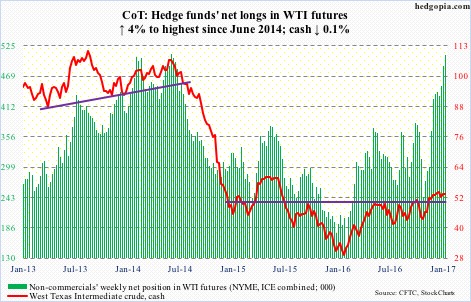
E-mini S&P 500: Are animal spirits back? Dow 20,000, the S&P 500 north of 2300, and the Nasdaq composite up 6.3 percent year-to-date. It surely looks like risk-on hats are out.
Safe to jump on the rally bandwagon, then? Probably not – unless you are a technically-inclined trader, who is riding it with proper stops in place.
With valuations stretched (particularly using trailing 12 months), spot VIX in the 10’s and pie-in-the-sky earnings expectations for this year and next, this is probably not a time for investors to be loading up the truck.
One group of investors/traders is doing exactly that. In the week ended Wednesday, $1.9 billion left SPY, the SPDR S&P 500 ETF. This was the third week in a row to see redemptions worth $8.8 billion (courtesy of ETF.com).
Also in the week ended Wednesday, $5.7 billion left U.S.-based equity funds. This followed outflows of $3.1 billion in the prior week (courtesy of Lipper).
For the trading-minded, the S&P 500 (2294.69) just broke out of nearly-a-month-and-a-half consolidation. It will be interesting to see what transpires when breakout test occurs around 2280.
Currently net long 72.9k, up 37.6k.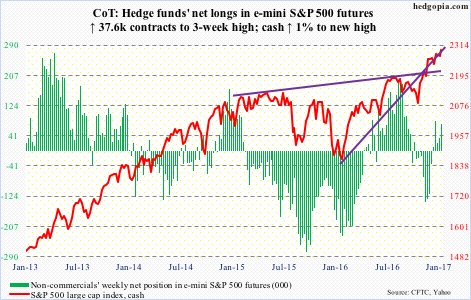
Euro: The cash, rising to 107.75 before reversing on Tuesday, came close to testing November 14 gap-down resistance at just under 108.
Daily conditions are grossly overbought. There is support at 105-plus. Before that lies the 20-day moving average (106.18) and the 50-day (105.93).
Currently net short 52.3k, down 14.2k.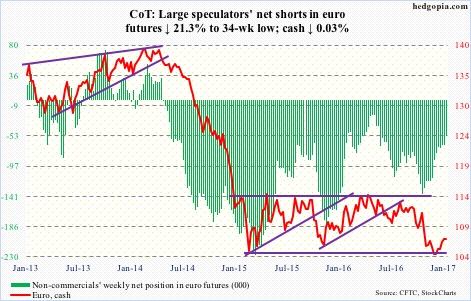
Gold: Turns out it was an exception than a rule. In the week ended Wednesday last week, GLD, the SPDR gold ETF, attracted $115 million. This was after nine consecutive weeks of outflows totaling $5.7 billion. This week (through Wednesday), $347 million came out (courtesy of ETF.com).
The 8.9-percent rally in the cash between December 15 and January 23 was not able to coax new funds. Now, the metal ($1,188.4/ounce) is itching to go lower.
Gold bugs need to defend $1,185, which also approximates the 50-day moving average ($1,178.43). The latter was defended on Friday.
Currently net long 109.4k, up 2.4k.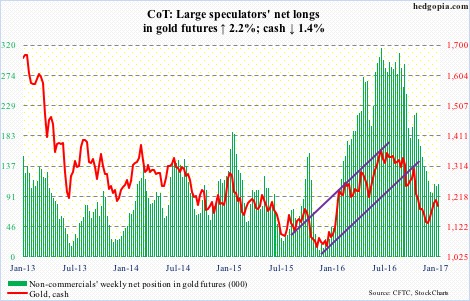
Nasdaq 100 index (mini): At the end of October last year, short interest on XLK, the SPDR technology ETF, was 18.4 million. Tech, along with stocks in general, bottomed early November, but began to lag post-U.S. presidential election. By the end of November, XLK short interest jumped to 35.9 million.
Come 2017, tech was back in favor. Year-to-date, the Nasdaq composite is up 5.2 percent. Shorts are probably helping. By mid-January, XLK short interest was down to 26.2 million. It is possible it went down more this week.
The Nasdaq 100 (cash) jumped to a new record high, with shorter-term moving averages going nearly parabolic.
Price action is great, but it is not winning the vote of flows. In the week ended Wednesday, QQQ, the PowerShares Nasdaq 100 ETF, lost $2.1 billion (courtesy of ETF.com).
Currently net long 87.7k, down 1.3k.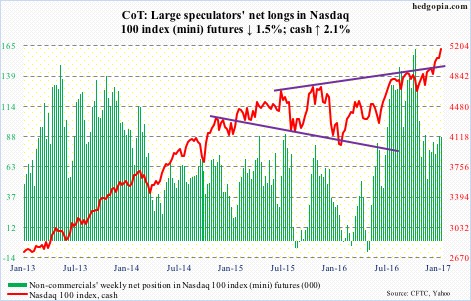
Russell 2000 mini-index: Yet another week, and yet another withdrawal from IWM, the iShares Russell 2000 ETF. In the week through Wednesday, $1.2 billion was redeemed. In the prior two, $572 million came out (courtesy of ETF.com).
The Russell 2000 (cash) all the same had a strong week, rallying 1.4 percent and retaking both 10- and 20-day moving averages. This followed defense of the 50-day for three straight sessions late last week and early this week.
Bulls nonetheless were unable to force a breakout. The cash has essentially gone sideways for the past seven weeks. Both the S&P 500 and the Dow Industrials broke out of a similar box this week, but not small-caps.
The 50-day is beginning to go flat.
Currently net long 75.4k, up 8k.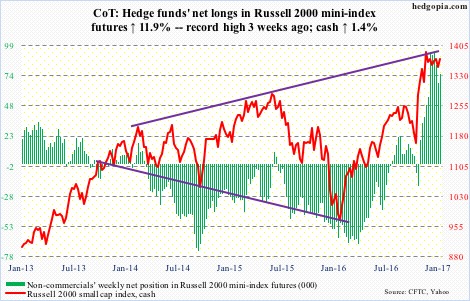
US Dollar Index: First, it was President Trump who said the strong dollar is killing U.S. companies’ ability to compete. Now, it is Treasury Secretary-nominee Steven Mnuchin who in a written response to a U.S. senator said a strong dollar may hurt the economy.
If this is not enough of a wink and a nod to the currency market as to which way the Trump administration leans, what is?
Besides overbought technicals, this is yet another roadblock to dollar bulls’ hopes for a sustained upward pressure on the US dollar index.
Speaking of which the cash broke out of March 2015 horizontal resistance post-election, but is struggling to save it.
A rising trend line drawn from the May 2016 low gets tested around 98.
Currently net long 48.4k, down 700.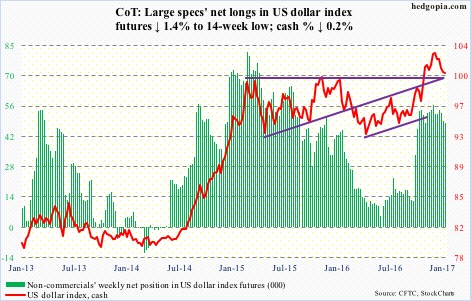
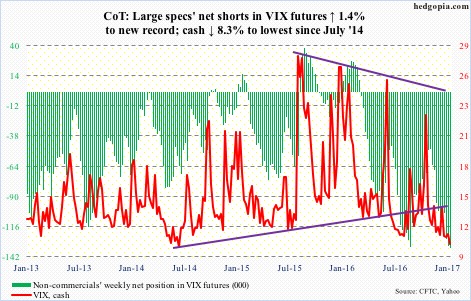
VIX: In the last three sessions, the cash dropped – and closed – below 11. (The last time VIX had intra-day drops below 11 for three sessions in a row was July 1-3, 2014.)
This is how the last three sessions looked – doji, inverted hammer, and doji.
VIX is at the low end of a years-long range, but also faces a 50-day moving average that trended lower from the middle of November last year. The good thing from volatility bulls’ perspective is that even if the cash goes sideways here, the average should begin to at least go flat.
Along the same lines, the VIX-to-VXV ratio continues to linger around severely oversold .70s – for fourth straight week and in eight out of last 10 weeks. That these conditions will get unwound is not a matter of if but when.
Non-commercials’ net shorts rose to a record high this week – another unwinding candidate in due course.
Currently net short 134.2k, up 1.8k.