Following futures positions of non-commercials are as of February 7, 2017.
10-year note: On January 26, 10-year yields began dropping after hitting 2.56 percent, lower than the 2.62 percent on December 15 – hence lower highs. In the meantime, they are finding support around 2.3 percent, thus forming a descending triangle pattern. Should the price break below the lower support, non-commercials who are massively net short 10-year-note futures likely come under pressure to cover. That is the risk these holdings carry.
On the daily chart, 10-year yields can rally. Near-term, that is. The 50-day moving average rests at 2.45 percent. Weekly, as well as monthly, conditions, however, remain overbought, with a potentially bearish MACD cross-under on the weekly chart. Odds favor the afore-mentioned descending triangle pattern completes in due course.
Currently net short 304.6k, down 49.1k.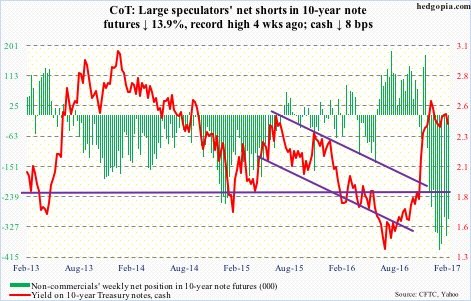
30-year bond: Major economic releases next week are as follows.
Tuesday brings the National Federation of Independent Business optimism index (January) and producer price index (January).
Small-business optimism surged 10.9 points in November and December. This was the largest two-month jump in the series’ history (data goes back to January 1986).
Producer prices in December were up 0.3 percent month-over-month; core PPI inched up 0.1 percent. PPI increased 1.6 percent from 12 months ago, and core PPI rose 1.7 percent.
Chair Yellen appears before Congress (semi-annual Humphrey Hawkins testimony) – Senate on Tuesday, House on Wednesday.
Also on Wednesday, consumer price index (January), retail sales (January), industrial production (January), NAHB housing market index (February), and Treasury International Capital (December) are on tap.
In December, consumer prices only managed to grow 0.3 percent m/m, even as core CPI inched up 0.2 percent. In the 12 months through December, they respectively increased 2.1 percent and 2.2 percent. This was the 14th straight month of core CPI rising north of two percent.
Retail sales advanced 0.6 percent m/m in December to a seasonally adjusted annual rate of $469.1 billion. They rose 4.1 percent year-over-year – second four-plus percent rise in the last three months.
Industrial production in December rose 0.5 percent y/y. This was the first y/y increase in 16 months. Capacity utilization inched up 0.1 percent y/y to 75.5 percent – first increase in 22 months. Utilization peaked at 78.9 percent in November 2014.
Builder sentiment dropped two points m/m to 67 in January. December (69) was the highest since 70 in July 2005.
In November, foreigners sold $205 million in U.S. Treasury bonds and notes – down from monthly average selling of $43.4 billion in the prior seven months. The trend is down, with the 12-month running total of minus $356.8 billion – a record.
Housing starts (January) are published on Thursday. In December, starts jumped 11.3 percent m/m to a seasonally adjusted annual rate of 1.23 million, after being down 16.5 percent in November. October’s 1.32 million was the highest since 1.35 million in July 2007.
Currently net short 36.9k, up 627.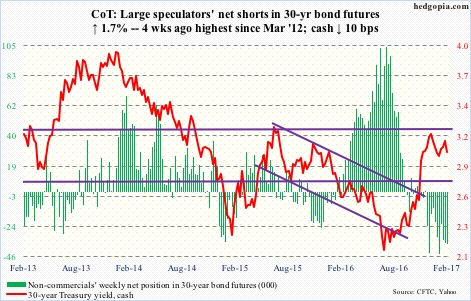
Crude oil: Same old, same old. Yet another week of oil bulls failing to take out $54-plus on spot West Texas Intermediate crude. Intraday Wednesday, it dropped below $52-plus but that support was reclaimed by close – an impressive reversal given the weekly EIA report out that day showed massive buildup in crude inventory.
For the week of February 3, crude stocks surged 13.8 million barrels to 508.6 million barrels – a 38-week high.
Distillate inventory inched up 29,000 barrels to 170.7 million barrels – the highest since October 2010.
Crude imports rose 1.1 million barrels per day to 9.4 mb/d – the highest since September 2012.
Refinery utilization inched down five-tenths of a point to 13-week low 87.7 percent.
And crude production increased 63,000 b/d to nine mb/d – a 44-week high. Production peaked at 9.61 mb/d in June 2015.
On the positive, gasoline stocks fell 869,000 barrels to 256.2 million barrels. The prior week was the highest since last February.
Near term, bulls have an opportunity to go after the afore-mentioned resistance, which in fact was tagged twice this week, including Friday. Medium term, the path of least resistance remains down.
Currently net long 505.2k, down 17.7k.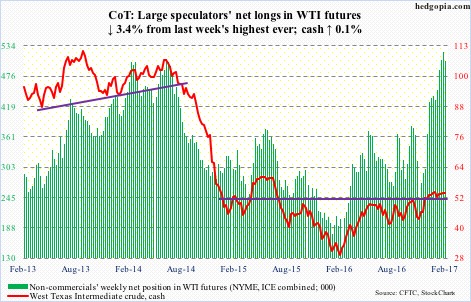
E-mini S&P 500: Yet another record on the cash … rallied Friday to an intra-day high of 2319.23. Prior to this, in the week through Wednesday, SPY, the SPDR S&P 500 ETF, lost $3 billion (courtesy of ETF.com). That said, in the same week, $2.4 billion moved into U.S.-based equity funds, following $13.8 billion in inflows in the prior week (courtesy of Lipper). Post-Nov 8 election, these funds have attracted north of $30 billion, and SPY $15.1 billion.
The election has given birth to giddy expectations.
Investors Intelligence bulls have come in north of 50 in the last 12 weeks, with four out of the last six in the 60’s.
As overbought as the cash is, buyers have so far been ably defending the shorter-term moving averages. As things stand, odds are stacked against shorts until these averages roll over. The cash has been rallying along a rising trend line from the lows of February last year.
With all that said, it is probably also time to be looking for reversal signs.
Currently net long 54.3k, down 16.5k.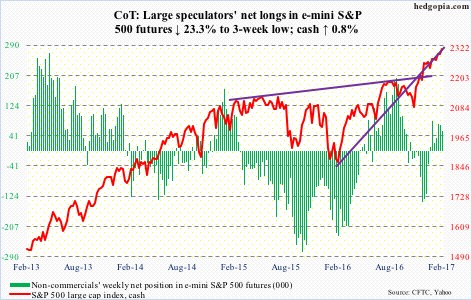
Euro: On February 2, the cash filled the gap of November 14 last year. The 108.29 high six sessions ago proved fatal. Sort of. The currency has been under pressure since.
The 50-day moving average – slightly rising to flat – was tested Friday. Successfully. If this is lost, then there is horizontal support at 105-plus – a must-save.
Currently net short 45k, down 762.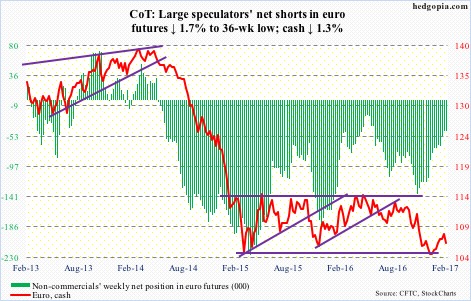
Gold: On both Wednesday and Thursday, the cash rallied to $1,246-plus and was met with selling pressure. This was a price level off of which the metal rallied in October last year. Daily conditions are overbought, so it makes sense to be stalling at resistance.
But so long as gold bugs show up near 10- and 20-day moving averages – both rising – the metal has a shot at the 200-day ($1,266.49).
Flows are cooperating. In the week ended Wednesday, GLD, the SPDR gold ETF, attracted $909 million. This came on the heels of inflows of $416 million in the prior week (courtesy of ETF.com).
Currently net long 117.1k, down 2k.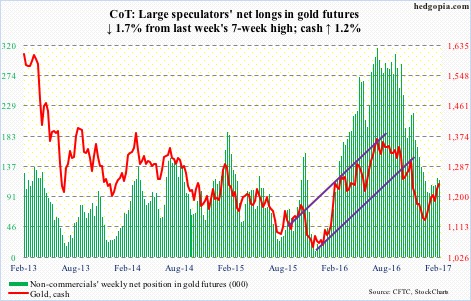
Nasdaq 100 index (mini): Apple (AAPL) boasts of a daily RSI (14) of 87.2! This pretty much sums up the state of affairs on the Nasdaq 100 (cash). It is already up north of 7.5 percent year-to-date. Rather astonishingly, it has rallied in the face of outflows of $1.2 billion this year from QQQ, the PowerShares Nasdaq 100 ETF. In the week ended Wednesday, $819.1 million was withdrawn (courtesy of ETF.com).
With that said, momentum is intact. In 2017, only once has the cash closed below the 10-day moving average, which, along with the 20-day, is still rising. Bears need to force them lower to get any traction.
Currently net long 92.4k, down 7.3k.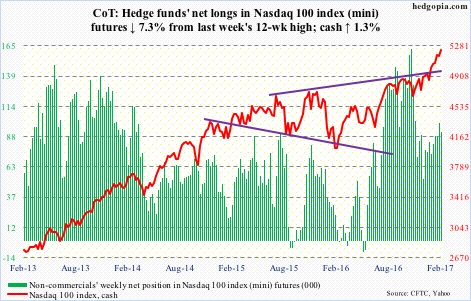
Russell 2000 mini-index: Nine and counting. That is the number of weeks the cash has gone sideways in a rectangle/flag formation. For as long as this consolidation has taken place, a break either way will be significant. Particularly so as this is one of the major U.S. indexes yet to post a fresh new high. The December 9 high of 1392.71 stands.
Friday, the cash closed right underneath that resistance. This is as good a chance as any for small-cap bulls to force a breakout next week. We will see. On the weekly chart, there has been back-to-back hanging man (potentially bearish).
Flows have been off and on, and this is not what the bulls want. In the week ended Wednesday, $1.1 billion left IWM, the iShares Russell 2000 ETF (courtesy of ETF.com).
Currently net long 49.1k, down 4k.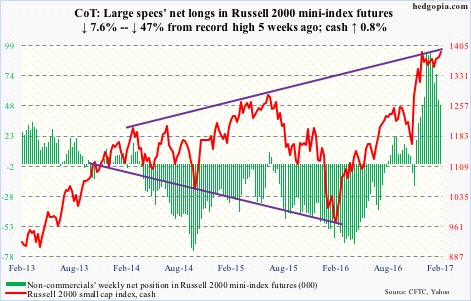
US Dollar Index: The cash did not quite test a rising trend line from last May, but did retrace 38.2 percent of the May 3, 2016-January 3, 2017 rally when it dropped to 99.20 on February 2. This area also held three-month horizontal support.
The subsequent rally understandably is struggling at resistance going back to March 2015. The dollar index broke out of it last November, followed by a drop underneath last month. What happens here will be a big tell.
There is room for weekly conditions to continue to head lower. At the same time, they have reached the median. In the current context, there is no better place for dollar bulls to step up and force theses indicators up, if they could.
Currently net long 46.7k, up 161.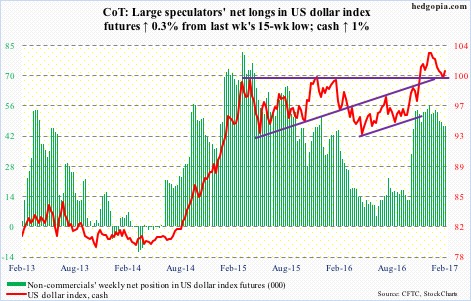
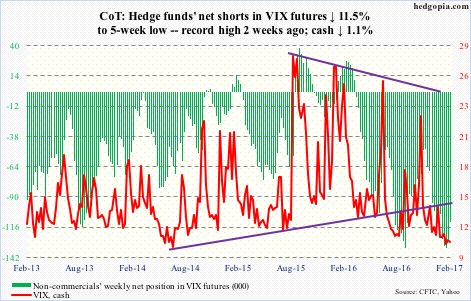
VIX: Sub-11 again – third straight weekly close with a 10 handle. This followed an intraday drop last week to 9.97 – the lowest since February 2007. As suppressed as these levels are, volatility continues to meander along the lower end of years-long range. Daily moving averages – 10, 20 as well as 50 – are all going flat. For volatility to begin to have legs, these averages need to start moving up.
Along the same lines, this was the sixth straight week – and in 10 out of last 12 – the VIX-to-VXV ratio lingered in the .70s – way oversold, and in need of unwinding.
Currently net short 111.8k, down 14.5k.