
Following futures positions of non-commercials are as of April 25, 2017.
10-year note: Currently net long 214.6k, up 255.9k.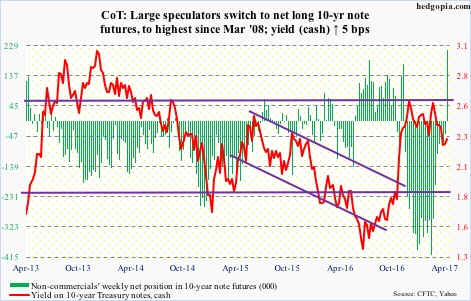
Ten-year Treasury yields did indeed test support-turned-resistance at 2.31 percent this week. In fact, they rose all the way to 2.35 percent Wednesday before weakening.
Yields bobbed up and down between 2.62 percent and 2.31 percent for five months before dropping out of the range on April 11, bottoming at 2.18 percent four trading sessions later.
In the week ended February 28, non-commercials had the most net shorts ever in 10-year-note futures – 409,659 contracts. By Tuesday this week, they switched to net long 214,642 contracts, which were the highest since March 2008. It is a swing of 624,000-plus contracts in eight weeks! This probably played a role in yields dropping from 2.62 percent on March 10 to the afore-mentioned low.
On the daily chart, yields can continue to come under pressure. For now, they are likely trapped between 2.31 percent and 2.18 percent. A loss of the latter opens the door for testing the 200-day moving average (2.09 percent), which should also fill one of the two gaps post-election last year. The other one gets filled once yields drop to 1.87 percent.
30-year bond: Currently net long 20.6k, up 23k.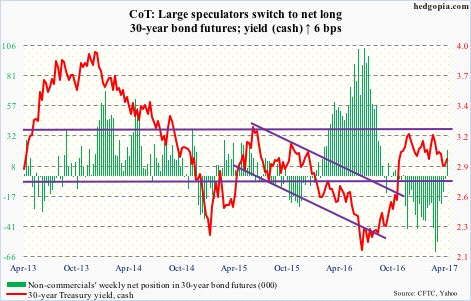
Major economic releases next week are as follows.
Monday brings the ISM manufacturing index (April) and personal income and outlays (March).
March manufacturing activity fell five-tenths of a point month-over-month to 57.2. February’s 57.7 was the highest since 57.9 in August 2014.
Core PCE (personal consumption expenditures) rose 1.75 percent year-over-year in February. Prices have been trending higher since they grew at 1.31 percent in July 2015. That said, the last time core PCE rose north of two percent was in April 2012. This is the Fed’s favorite measure of consumer inflation.
FOMC meeting begins Tuesday, and ends the next. They will for sure stand pat. Futures are only pricing in five percent odds of a 25-basis-point hike – then rising to 63 percent and 60 percent, respectively, for the June and July meetings.
April’s ISM non-manufacturing index is published on Wednesday. March fell 2.4 points m/m to 55.2. February was the highest since 58.1 in October 2015.
Productivity (1Q17, preliminary) and durable goods (March, full) come out on Thursday.
Non-farm business output per hour increased at a 1.3-percent annual rate in 4Q16, decelerating from 3.3 percent in 3Q16. This was preceded by three consecutive declines in 4Q15-2Q16.
March’s advance report showed orders for capital goods ex-aircraft rose three percent y/y. This was the fourth straight y/y increase, following 13 months of y/y declines in a row.
The employment report for April is due out on Friday. In the first three months this year, non-farm payroll averaged 178,000. In 2016, the average was 187,000, softer than 226,000 in 2015 and 250,000 in 2014.
Crude oil: Currently net long 441.6k, down 41.6k.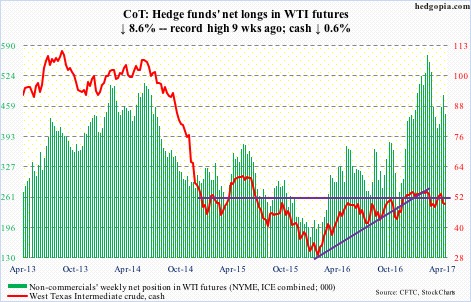
The latest EIA report was a mixed bag.
In the week ended April 21, U.S. crude stocks fell 3.6 million barrels to 528.7 million barrels. This was the third straight week-over-week drop since reaching a record 535.5 million barrels three weeks ago.
Refinery utilization rose 1.2 percentage points to 94.1 percent – the highest since late November 2015.
Gasoline and distillate stocks both rose – the former by 3.4 million barrels to 241 million barrels and the latter by 2.7 million barrels to 150.9 million barrels.
Crude imports rose, too – by 1.1 million barrels per day to 8.9 mb/d – an 11-week high. Production continued to inch higher – this time by 13,000 b/d to 9.3 mb/d. Since OPEC reached a cutback agreement late November last year, U.S. crude production has gone up by 566,000 b/d.
Spot West Texas Intermediate crude (49.33) came close to testing support at 47, but not quite. It dropped to 48.20 Thursday (higher lows?) before finding support at the lower Bollinger band, and has room to rally near term provided the 200-day moving average (49.07) is not lost.
E-mini S&P 500: Currently net long 122.1k, down 12.1k.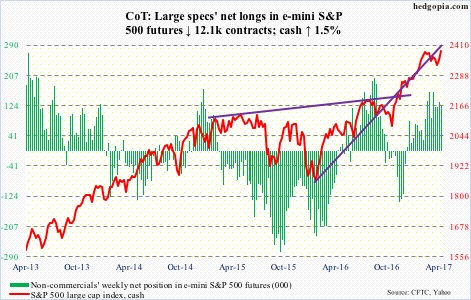
After losing $9.3 billion in the prior three weeks, SPY, the SPDR S&P 500 ETF, gained $2.8 billion in the week ended Wednesday (courtesy of ETF.com).
In the same week, U.S.-based equity funds attracted $7.2 billion (courtesy of Lipper).
This, however, was not enough to push the S&P 500 (cash) past 2400.98, the all-time high reached on March 1. Tuesday came close, as it rallied to 2398.16 before reversing lower. It closed out the week at 2384.2.
The 50-day moving average, which the index closed under for seven straight sessions before recapturing this week, is 0.9 percent away. A test looks imminent near term.
Euro: Currently net short 20.9k, down 754.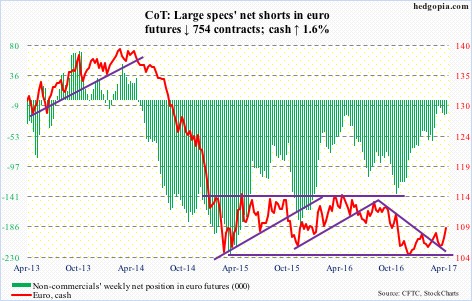
Mario Draghi, ECB president, Thursday sais risks surrounding the euro area’s growth outlook remained tilted towards the downside, at the same time adding that these risks were less severe given the bloc’s economic expansion. Essentially speaking from both sides of his mouth.
Thursday, confused euro (cash) was all over – trading in a wide range of 109.33 and 108.52, before bouncing off the 200-day moving average to close at 108.75, down 0.3 percent. This was preceded by a feeble break Tuesday out of a declining trend line from last May.
The currency reclaimed the 200-day this week, but odds favor it loses it near term. A trend line from early January this year draws to 106.50. Right around there lies support from the 50-day (106.85).
Gold: Currently net long 200.7k, up 4.9k.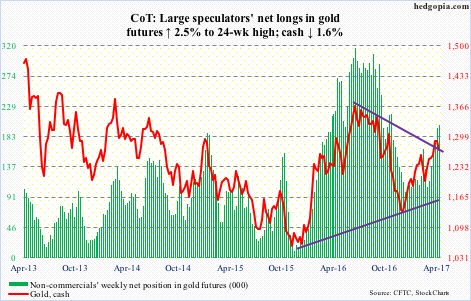
After getting repelled at resistance at $1,300 two weeks ago, the cash has trended lower, currently just above the 200-day moving average ($1,257.29) – now slightly falling.
For a month and a half beginning late February, that average repelled several breakout attempts, thus its significance when it gets tested. If gold bugs are unable to save it, the rising 50-day ($1,249.3) below is a must-save.
In the week ended Wednesday, GLD, the SPDR gold ETF, lost $265 million. This followed inflows of $1.1 billion in the prior three (courtesy of ETF.com).
Nasdaq 100 index (mini): Currently net long 114.5k, up 8.7k.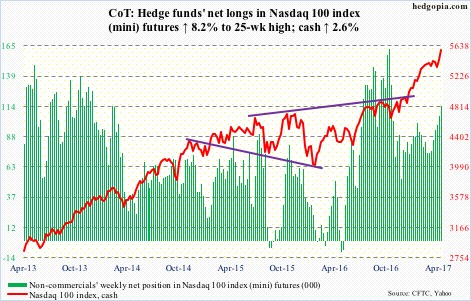
Yet another breakout to a new all-time high. The cash had a major breakout last August, followed by six straight monthly increases through this month.
This week, it broke out of month-and-a-half horizontal resistance at 5400. Non-commercials were right to be gradually adding in the past several weeks. Flows helped as well.
In the week ended Wednesday, QQQ, the PowerShares Nasdaq 100 ETF, gained $336 million (courtesy of ETF.com).
The index is grossly overbought near term – closed outside the upper Bollinger band in all five sessions this week. A retest of the recent breakout – likely near term – is 3.3 percent away.
Russell 2000 mini-index: Currently net short 30.3k, down 41.9k.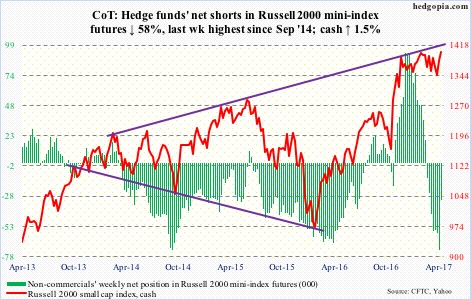
After remaining range-bound for five months, the cash (1400.43) broke out this week, past its 50-day moving average, and past its prior high of 1414.82 reached on March 1.
Flows fully cooperated. In the week ended Wednesday, IWM, the iShares Russell 2000 ETF, took in $2.6 billion. In the prior four, it lost $3.1 billion (courtesy of ETF.com).
This week’s rally also pushed the index into daily overbought territory, rallying along the sharply rising upper Bollinger band in the first four sessions, before dropping 1.2 percent Friday.
The best the bulls can hope for near term is a successful breakout retest at 1390-ish, or the 50-day moving average (1379.21).
US Dollar Index: Currently net long 43.5k, up 104.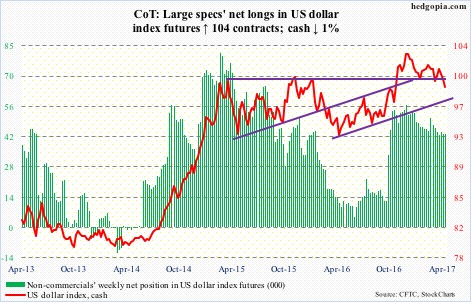
Since it got rejected by a four-month declining trend line on the 10th this month, the cash (98.9) has been under pressure, losing the 50-day moving average in the process.
This week, the dollar index traded around the 200-day (98.97), which it has not lost since early October last year. This area – just north of 91 – also approximates the neckline of a head-and-shoulders formation. Dollar bulls cannot afford to lose this support.
VIX: Currently net short 68.8k, down 16.8k.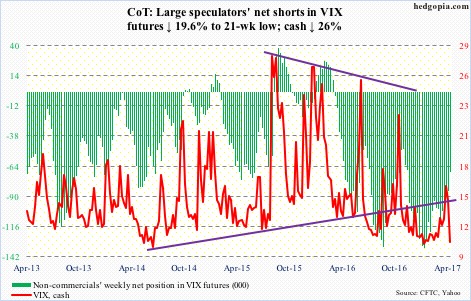
Spike reversals on the cash have been progressively making lower highs – 53.29 (August 2015), 32.09 (January 2016), 26.72 (June 2016), 23.01 (November 2016), and 16.28 two weeks ago. When – not if – a breakout occurs, this can have massive implications for volatility.
For now, since the latest peak, VIX (10.82) quickly fell to the bottom of a multi-year range, dropping intraday to 10.22 Monday. Henceforth, the path of least resistance is up. The question is if it shoots right back up or goes sideways before jumping.
The same goes with the VIX-to-VXV ratio, which fell from 1.01 two weeks ago to .809 on Thursday. Prior to the recent spike/swoon, the ratio lingered in high-.70s/low-.80s for weeks.
