
Following futures positions of non-commercials are as of July 18, 2017.
10-year note: Currently net long 282.3k, up 25.3k.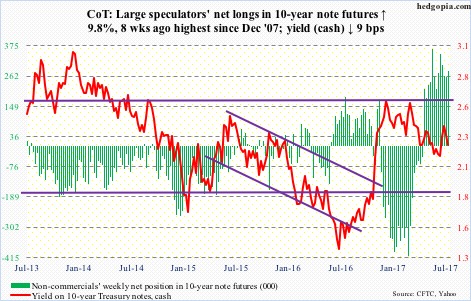
Through Wednesday, $1.1 billion moved into TLT (iShares 20+year Treasury bond ETF) this month (courtesy of ETF.com).
In late April, non-commercials switched from net short to net long 10-year note futures. Eight weeks ago, their holdings were the highest since December 2007.
Since March this year, TLT has been making higher highs, with the 50-day moving average (simple) pointing up. Momentum is behind TLT longs/non-commercials.
Concurrently, since July 7, 10-year T-yields (2.23 percent) have come under pressure, losing both the 50- and 200-day this week. As early as mid- to late-June, 10-year notes were yielding 2.1 percent. In the right circumstances, there is room for a test of these lows.
30-year bond: Currently net long 51.5k, up 1k.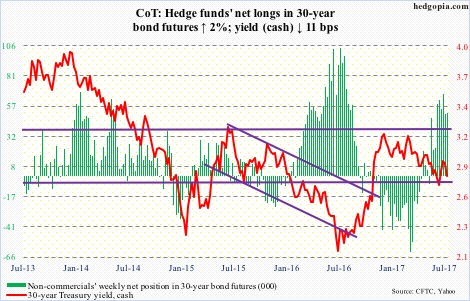
Major economic releases next week are as follows.
Existing home sales for June come out on Monday. May sales were up 1.1 percent month-over-month to a seasonally adjusted annual rate of 5.62 million units. March’s 5.7 million was the highest since 5.79 million in February 2007.
Tuesday, FOMC meeting begins, and ends the next. After this, three more meetings remain this year. No hike is expected next week, with December holding the highest odds this year, that too at 43 percent.
Also Tuesday, the S&P Corelogic Case-Shiller home price index for May comes out. Nationally, home prices rose 5.5 percent year-over-year in April – slight deceleration from February’s pace of 5.64 percent.
New home sales for June are on tap for Wednesday. May was up 2.9 percent m/m to 610,000 units (SAAR). March’s 644,000 was the highest since 727,000 in October 2007.
The advance report on durable goods for June is scheduled for Thursday. Orders for non-defense capital goods ex-aircraft – proxy for business capital expenditures – increased 5.5 percent y/y in May to $63.2 billion (SAAR). This was the fifth up month in last six after 25 consecutive down months. Orders peaked at $70.3 billion in September 2014.
Friday brings GDP (2Q17, advance), the employment cost index (2Q17), and the University of Michigan’s consumer sentiment index (July, final).
The Atlanta Fed’s GDPNow model is forecasting 2.5-percent growth in real GDP in 2Q17. Growth was 1.4 percent in 1Q17. Post-Great Recession, growth has been mediocre, with the average between 3Q09 and 1Q17 of 2.1 percent, versus 3.2 percent going all the way back to 2Q47.
Private-sector compensation costs rose 2.3 percent y/y in 1Q17 – wages and salaries rose 2.6 percent and benefits 1.3 percent.
Preliminarily, consumer sentiment dropped two points m/m in July to 93.1. Sentiment has fallen quite a bit after it shot up to 13-year high 98.5 in January.
Crude oil: Currently net long 429.1k, up 36k.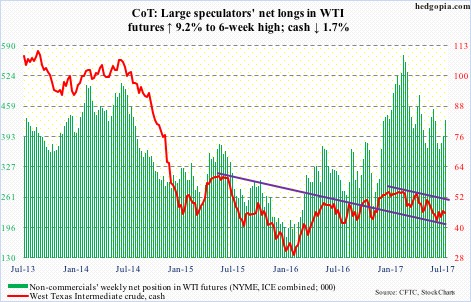
The EIA report out Wednesday offered good news on the inventory front.
For the week ended July 14, U.S. crude stocks dropped 4.7 million barrels to 490.6 million barrels – now down 44.9 million barrels from record 535.5 million barrels in the March 31st week. Nevertheless, stocks are still much higher versus the five-year average of 408.6 million barrels.
Gasoline stocks fell 4.4 million barrels to 231.2 million barrels – a 29-week low – while distillate stocks dropped 2.1 million barrels to 151.4 million barrels.
Crude imports, on the other hand, rose 386,000 barrels per day to eight million b/d.
Crude production, too, rose – up 32,000 b/d to 9.43 mb/d. Since OPEC reached an agreement to cut back production by 1.8 mb/d last November, U.S. production has gone up by 730,000 b/d.
Refinery utilization fell five-tenths of a point to 94 percent.
Spot West Texas Intermediate crude reacted to the report by rallying 1.6 percent Wednesday, retaking – and then losing – the 50-day. Resistance at $47-plus held firm. The daily chart has entered overbought territory.
Amidst rumors of non-compliance, OPEC and non-OPEC members meet Monday in Russia to discuss the issue, among others.
E-mini S&P 500: Currently net long 102.4k, up 23.8k.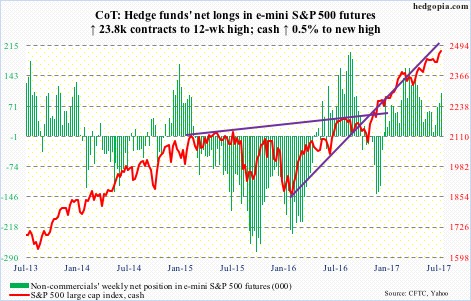
Last Friday’s mini-breakout on the cash was tested this week – successfully – quickly followed by a new high. The new number to beat: 2477.62.
Weekly and monthly charts have been in overbought territory, now joined by the daily. That said, shorter-term averages are rising, particularly the 10-day, which the bulls will try to defend for sure – at least initially.
As far as the flows go, the divergence among SPY (SPDR S&P 500 ETF), VOO (Vanguard S&P 500 ETF) and IVV (iShares core S&P 500 ETF) continued with the former losing $2.6 billion in the week to Wednesday and the latter attracting $2.6 billion. VOO lost $61 million (courtesy of ETF.com).
In the same week, U.S.-based equity funds lost $2.6 billion (courtesy of Lipper). In the last five weeks, four saw outflows, totaling $14.3 billion.
Euro: Currently net long 91.3k, up 7.5k.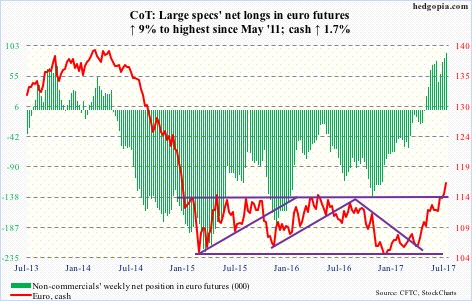
Mario Draghi, ECB president, Thursday essentially talked out of both sides of his mouth.
He said a substantial degree of monetary accommodation was still needed for underlying inflation pressures to gradually build up. This was his dovish side. He also said they had not yet discussed the future of QE, but would in September. This was his hawkish side.
The euro had a seesaw session Thursday, but in the end decided it was time to bet on the hawk. For the week, the cash rallied 1.7 percent to 116.61, past a two-and-a-half-year, 10-point rectangle. If it is a genuine breakout, the euro is headed much higher. The problem is, this for sure would not be drawing cheers from Mr. Draghi, or for exporters like Germany. How long before he tries to jawbone the currency lower?
Gold: Currently net long 60.1k, down 122.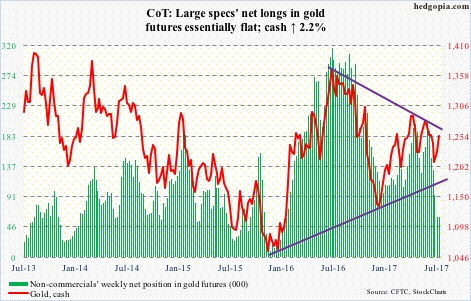
GLD (SPDR gold ETF) continued to bleed in the week through Wednesday, losing $645 million. The ETF has now lost $1.5 billion in the past five weeks (courtesy of ETF.com).
Gold bugs deserve kudos, as this did not impact how the cash ($1,254.9/ounce) acted. The metal further built on last week’s trough, also reclaiming both the 50- and 200-day. A trend line drawn from July last year will be tested around $1,270.
Nasdaq 100 index (mini): Currently net long 38.8k, up 8k.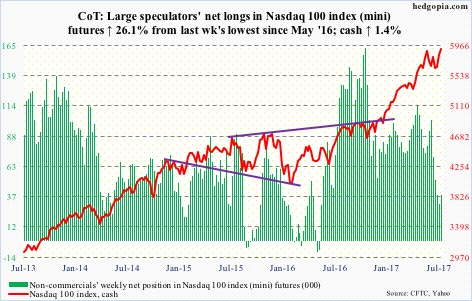
After five weeks of outflows totaling $3 billion, QQQ (PowerShares Nasdaq 100 ETF) experienced inflows for the second week running – $3.1 billion in total, $663 million of which came in the week ended Wednesday (courtesy of ETF.com).
The 5.4-percent drop, nearly lasting a month, since June 9 (5897.69) has all been recouped, and then some. Wednesday, it surpassed that high, followed by a new high Thursday (5932.61).
Shorts likely lent a helping hand. Short interest on QQQ, XLK (SPDR technology ETF), or the Nasdaq composite for that matter, remains elevated. Mid-July numbers will be reported Tuesday.
Russell 2000 mini-index: Currently net short 30k, down 7.5k.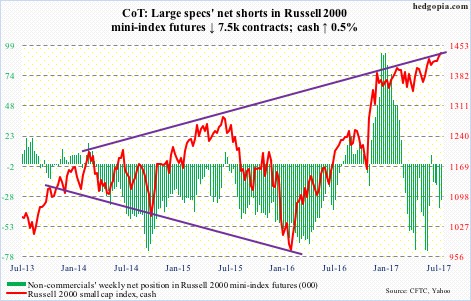
Small-cap bulls continue to hammer on the upper bound of a rising channel from last December. No breakout yet, with the cash reversing hard Friday after rising to a new all-time high of 1452.05. This followed Thursday’s long-legged doji.
Flows continue to be a problem.
In the week to Wednesday, IWM (iShares Russell 2000 ETF) witnessed outflows in every single session, for a total of $1.4 billion. In the past four weeks, redemptions totaled $3 billion. On Wednesday, when the Russell 2000 rallied one percent to a new high, $574 million came out of the ETF (courtesy of ETF.com).
US Dollar Index: Currently net long 2.1k, down 288.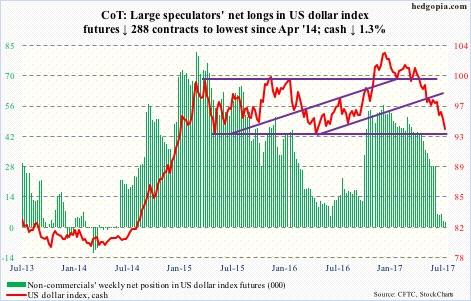
The euro comprises 57.6 percent of the US dollar index. The former’s gain was the latter’s loss on Thursday, down 0.5 percent.
The US dollar index has been under incessant pressure since it peaked early this year, and is at/near crucial support. Between May last year and the peak early this year, it rallied 13 percent. At 94.70, it retraced 76.4 percent of that move – an important Fibonacci level.
This week also saw completion of a measured-move target of a head-and-shoulders pattern that formed over several months late last year and early this year.
Also, for two and a half years now, barring a false breakout last November, the dollar index (93.68) has been range-bound, with the lower bound north of 93. Dollar bulls better be hoping this support holds.
VIX: Currently net short 140.4k, up 30.1k.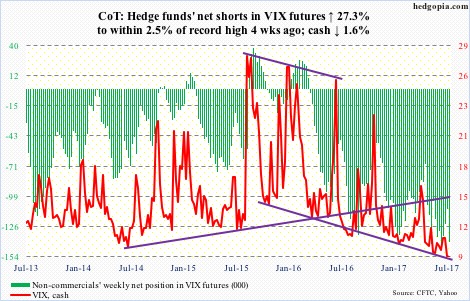
Through Friday, the cash closed below 10 for seven straight sessions. In the history of VIX (going back to 1990), there have only been 21 sub-10 closes, 12 of which occurred since May this year. Talk about volatility suppression!
Volatility bulls will have their day – whenever that is. Misery will end when it ends.
At least near term, the CBOE equity put-to-call ratio has been in the .50s the past three sessions. Things are complacent.
Thanks for reading! Please share.
