Following futures positions of non-commercials are as of June 18, 2019.
10-year note: Currently net short 403k, up 37k.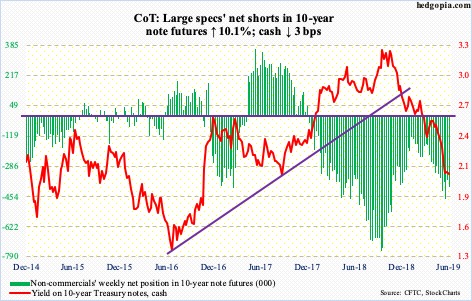
Yet another intraday low on the 10-year Treasury yield this week! Since peaking at 3.25 percent last October, there has been a distinct pattern of lower highs and lower lows. Thursday, the 10-year (2.07 percent) fell three basis points to two percent, with an intraday low of 1.98 percent. With that, the September 2017 low of 2.03 percent has been breached. Thursday also produced a spinning top right above the daily lower Bollinger band. Plus, there was a weekly hammer. A relief could be at hand, provided rates begin to consolidate at these levels. Daily and weekly indicators are in oversold territory. In the event of a rally, immediate resistance lies at 2.18 percent (gap-down), followed by 2.36 percent (short-term horizontal) and 2.62 percent (decade-old horizontal).
Bond vigilantes, who have played cautious since last October, were sort of vindicated this week as the Fed signaled a willingness to cut policy rates. Stocks in the meanwhile continue to diverge with the long end of the yield curve. They are hoping the Fed would be cutting rates aggressively in months to come and that this would stop the economy from sliding into recession. The fed funds rate is already at 2.4 percent. The current expansion is a week from completing a decade. Would lower rates matter at this point in the cycle? Time will tell.
30-year bond: Currently net long 18.3k, up 101.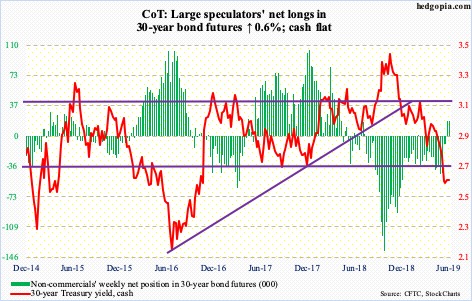
Major economic releases next week are as follows.
Tuesday brings the S&P Case-Shiller home price index (April) and new home sales (May).
Nationally, home prices in March rose 3.7 percent year-over-year – decent but much slower than the 6.5 percent pace clocked in March last year.
New home sales dropped 6.9 percent month-over-month in April to a seasonally adjusted annual rate of 673,000 units. March’s 723,000 was the highest since October 2007.
May’s durable goods orders are due out Wednesday. April orders for non-defense capital goods ex-aircraft – proxy for business capex plans – increased 1.2 percent y/y to $68.7 billion (SAAR). Orders peaked last July at $70 billion.
Thursday, 1Q19 GDP (third revision) and 1Q19 corporate profits (revised) are published.
The second estimate showed real GDP grew 3.1 percent last quarter. As of June 18, the Atlanta Fed’s GDPNow model forecasts this is expected to decelerate to two percent growth in the current quarter.
Preliminarily, corporate profits with inventory valuation and capital consumption adjustments grew 3.1 percent y/y to $2.25 trillion (SAAR) – quite a deceleration from the 10.4 percent pace of 3Q18. Profits peaked at $2.32 trillion in that quarter.
Personal income/spending (May) and the University of Michigan’s consumer sentiment index (June, final) are on tap Friday.
Core PCE – the Fed’s favorite measure of consumer inflation – increased 1.6 percent in May. Going back seven years, there has been only one month (last July) in which this metric grew with a two handle.
June’s preliminary reading showed consumer sentiment fell 2.1 points m/m to 97.9. Since October 2017, this metric has been at/above 100 four times, one of which was March last year. The 101.4 reading back then was the highest since January 2004.
Crude oil: Currently net long 512.8k, up 31.3k.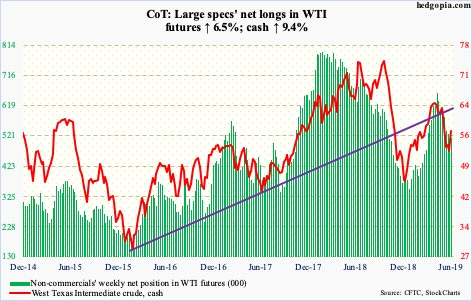
The cash ($57.43/barrel) fell from $66.60 on April 23 to $50.60 on June 5, before going sideways. Support at $50-51 was defended several times over two weeks. Tuesday’s 4.2-percent rally brought the crude to resistance at $54-55. Thursday’s 5.7-percent jump easily cleared that ceiling. Oil rallied on concerns over possible US retaliation against the downing of its drone by Iran. The 50- and 200-day moving averages lie right above – $59.56 and $59.21, respectively. There is also horizontal resistance just north of $60.
Bullish sentiment also got help from the EIA report for the week of June 14. US crude production dropped 100,000 barrels per day to 12.2 million bpd. Two weeks before that, a record 12.4 mbpd was pumped. Crude imports fell 144,000 bpd to 7.5 mbpd. Stocks of crude, gasoline and distillates all declined – by 3.1 million barrels, 1.7 million barrels and 551,000 barrels to 482.4 million barrels, 233.2 million barrels and 127.8 million barrels, in that order. Refinery utilization rose seven-tenths of a percentage point to 93.9 percent – a 22-week high.
E-mini S&P 500: Currently net long 51.9k, down 3k.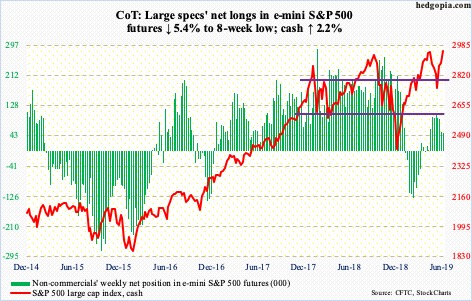
A new high! Trader hopes are rising for a trade deal between the US and China as Presidents Donald Trump and Xi Jinping meet at the G20 meeting slated for June 28-29. Further help came from the Fed, which seemed to have opened the door for possible easing. By Friday, the cash (2950.46) rallied to a new intraday high of 2964.15, although the session’s early strength was faded by close. The daily is extremely overbought. Nearest support lies at 2900.
The S&P 500 large cap index is now up 17.7 percent for the year. Bulls have been able to achieve this feat without much help from foreigners and margin debt. In the 12 months to April, foreigners sold $214.2 billion in US stocks – a new record. FINRA margin debt in May dropped $20 billion month-over-month to $568.8 billion, down $100.2 billion from the peak set in May last year.
Flows were mixed this week. In the week to Wednesday, US-based equity funds lost $3.7 billion (courtesy of Lipper). In the same week, SPY (SPDR S&P 500 ETF), VOO (Vanguard S&P 500 ETF) and IVV (iShares core S&P 500 ETF) gained a combined $3.4 billion (courtesy of ETF.com).
Euro: Currently net short 52.3k, down 34.5k.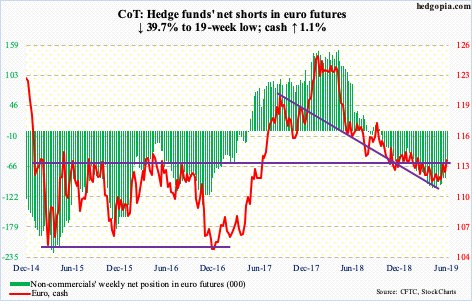
The cash ($113.81) seesawed this week. Tuesday, Mario Draghi, ECB president, said if inflation failed to pick up, more policy easing could be on the way. The currency dropped 0.2 percent in that session, losing the 50-day; but buyers showed up in defense of $111.80s, resulting in a long-legged doji.
Come Wednesday, the euro rallied 0.3 percent, then 0.6 percent on Thursday and another 0.7 percent on Friday – to slightly past the 200-day. As well, the prior high of $113.48 from June 7 has been surpassed, for a higher high. The Fed’s dovish shift Wednesday was the catalyst.
Gold: Currently net long 204.3k, up 20.1k.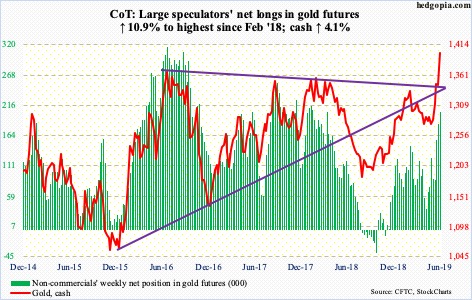
For gold bugs, things could not have fallen into place any better this week. Both the Fed and the ECB delivered a dovish message. The dollar tumbled. And flows cooperated. In the latter, GLD (SPDR gold ETF) in the week to Wednesday took in $189 million and IAU (iShares gold trust) $269 million (courtesy of ETF.com). This was IAU’s first positive week in 10, with the prior nine losing $849 million. Non-commercials’ net longs rose to the highest since February last year.
The cash ($1,400.10/ounce) surged 4.1 percent this week. With this, major resistance at $1,350s-1,360s has been taken care of. This ceiling goes back to October 2010.
Back in September 2011, gold peaked intraday at $1,923.70, then bottoming at $1,045.40 in December 2015. Since that low, the metal has charted out higher lows, but the afore-mentioned ceiling persistently came in the way. If genuine, this is a major breakout.
Nasdaq 100 index (mini): Currently net long 21.5k, up 9.9k.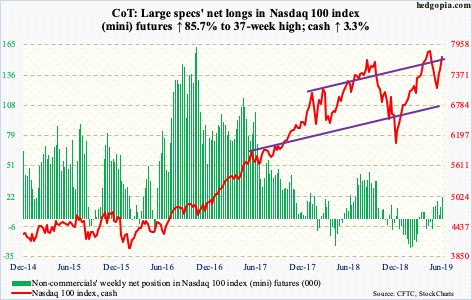
The cash (7728.78) is merely 1.6 percent from surpassing its all-time high of 7851.97 reached on April 25. After straddling the 50-day for several sessions, the Nasdaq 100 index bolted out of the average on Tuesday. Flows were not much in cooperation, though. In the week to Wednesday, QQQ (Invesco QQQ trust) lost $15 million (courtesy of ETF.com). This followed inflows of $1.5 billion in the prior week.
From the intraday low of 6936.68 on June 3 through Thursday’s high, the index rallied 12 percent. The daily is grossly overbought.
Russell 2000 mini-index: Currently net short 49k, up 7.2k.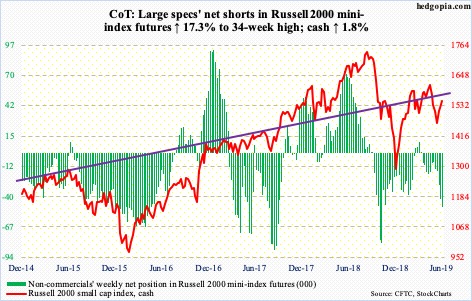
In the week to Wednesday, IWM (iShares Russell 2000 ETF) took in $1.2 billion and IJR (iShares core S&P small-cap ETF) $209 million (courtesy of ETF.com). This was IWM’s biggest weekly haul since last October.
After remaining just under the 200-day for several sessions, the cash (1549.63) rallied past the average on Tuesday, albeit barely. It closed Friday right on the 50-day.
For a while now, small-caps have fallen behind their large-cap brethren. This week did not change this dynamic. The Russell 2000 small cap index remains below major resistance just north of 1600. It peaked last August at 1742.09.
US Dollar Index: Currently net long 28.5k, up 4.6k.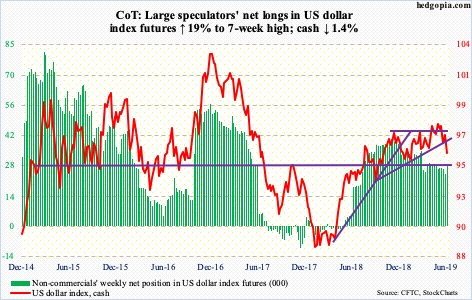
Weekly momentum indicators were already in the process of unwinding overbought condition. The Fed’s dovish shift added fuel to the fire. The cash (95.72) Tuesday was rejected at the 50-day, followed by sizable declines in each of the remaining three sessions. The 200-day has been lost. Ditto with a rising trend line from last September. Support lies just north of 95 – a must-save.
VIX: Currently net short 108.6k, up 17.5k.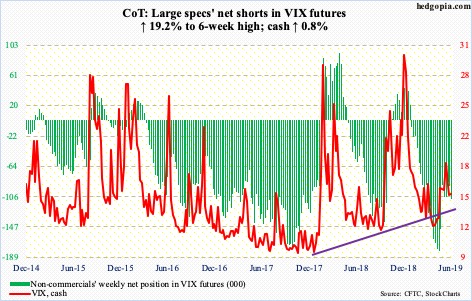
After clinging on to the 50-day for eight straight sessions, the cash (15.40) lost the average on Tuesday. By Thursday, VIX was down to 13.19 intraday, but rallied to close the session up 0.42 to 14.75. This was an interesting divergence as the S&P rallied one percent in that session. For the week, VIX rallied 0.8 percent, once again moving in the same direction as the S&P 500. This is rare. It closed out the week right on the 50-day.
The daily is in gross oversold territory. The weekly, however, is pointing lower. So it is going to be a battle between the two timeframes. In the event of a rally, the 200-day is at 17.21. As recently as June 3, VIX printed 19.75 intraday.
In the meantime, the 21-day moving average of the CBOE equity-only put-to-call ratio, which reached 0.706 on June 5, ended the week at 0.652. In the right circumstances for equity bulls, unwinding can continue until the ratio drops to low-60s/high-50s.
Thanks for reading!

