
Following futures positions of non-commercials are as of August 6, 2019.
10-year note: Currently net short 390.9k, up 7k.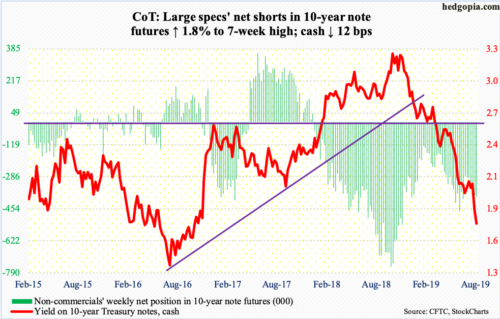
The 10-year Treasury yield (1.73 percent) dropped to 1.6 percent intraday Wednesday – the lowest since September 2016. July that year, rates fell to 1.34 percent, which was essentially a successful retest of 1.39 percent set in July 2012. It is probably just a matter of time before the 10-year heads back down there, and this time around the support may not hold.
The US economy is still growing. Yet, the long end of the bond market continues to attract bids, putting downward pressure on the yield. Most recently, rates peaked at 3.25 percent last October, and it has been all downhill since. We can just imagine how rates will behave when the next downturn hits. To that end, non-commercials, who are neck-deep in their bets on higher rates – and wrongly at that – will only provide a tailwind to this downward momentum.
30-year bond: Currently net short 56.3k, up 23.7k.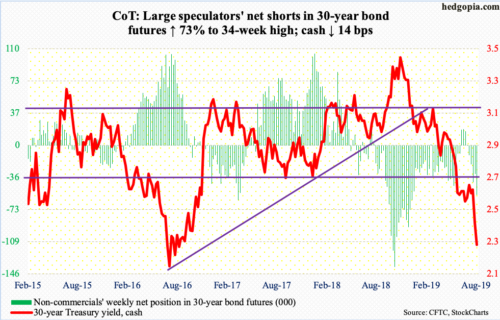
Major economic releases next week are as follows.
Tuesday brings the NFIB optimism index (July) and CPI (July).
Small-business optimism dropped 1.7 points month-over-month in June to 103.3. This was the 31st consecutive month of 100-plus reading, including 108.8 in August last year.
June consumer prices were up 0.1 percent m/m and 1.65 percent in the 12 months to June. Over the same time period, core CPI rose 0.3 percent and 2.13 percent respectively.
Retail sales (July), productivity (2Q19), capacity utilization (July), the NAHB housing market index (August) and TIC data (June) are due out Thursday.
In the 12 months to June, retail sales rose 3.4 percent to a seasonally adjusted annual rate of $519.9 billion – a new high.
From 1Q18 to 1Q19, non-farm business productivity rose 2.4 percent – the best pace since 3Q10.
Capacity utilization fell 0.2 percent m/m to 77.9 percent. Last November’s 79.6 percent was the cycle high.
Builder sentiment in July rose a point m/m to 65. The cycle high 74 in December 2017 was the highest since July 1999.
Foreigners sold $189 billion in US stocks in the 12 months to May, down from $214.2 billion worth in April, which was a record.
Housing starts (July) and the University of Michigan’s consumer sentiment index (August, preliminary) come out Friday.
Starts inched down 0.9 percent m/m in June to 1.25 million units (SAAR). They peaked this cycle at 1.34 million in January last year, which was the highest since July 2007.
Consumer sentiment edged up 0.2 points m/m in July to 98.4. Since October 2017, sentiment surpassed 100 four times, including 101.4 in March last year, which was the highest since January 2004.
Crude oil: Currently net long 520.5k, down 16k.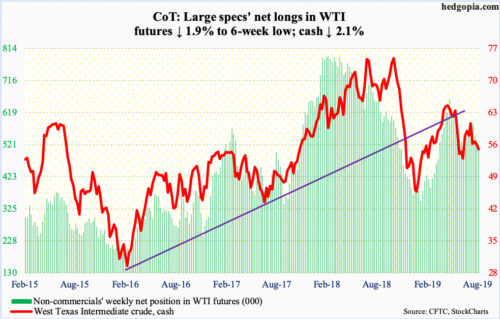
By Wednesday, the cash ($54.50/barrel) was already under severe pressure. The EIA report for the week of August 2 did not help, as WTI dropped another 4.7 percent in that session. Stocks rose across the board – crude up 2.4 million barrels to 438.9 million barrels, gasoline up 4.4 million barrels to 235.2 million barrels and distillates up 1.5 million barrels to 137.5 million barrels. Crude imports jumped 485,000 barrels per day to 7.15 million bpd. Crude production increased 100,000 bpd to 12.3 mbpd. Refinery utilization rose 3.4 percentage points to 96.4 percent – the highest since late December last year.
Wednesday’s drop put WTI right on $50-51 support, which bulls defended in the first half of June. On its way here, the crude lost both 50- and 200-day moving averages last week. A loss of $50-51 exposes WTI to a test of $45. The daily is oversold, so a relief is possible. A rising trend line from last December was breached this week. The underside of that broken trend line gets tested around $54, which bulls need to defend. Above, the 50-day rests at $55.82.
E-mini S&P 500: Currently net long 88.9k, up 26.4k.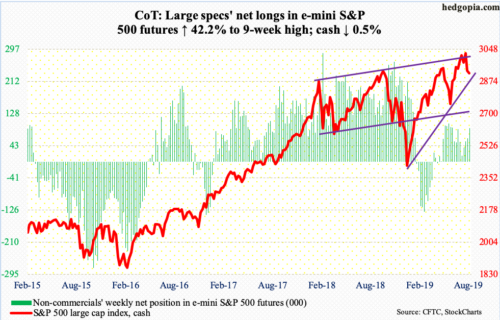
From the all-time high of 3027.98 on July 26 through Monday’s low of 2822.12, the cash (2918.65) quickly lost 6.8 percent. Amidst this, bulls found a reason to step up. Just north of 2800 has been an important price point for both bulls and bears going back to March last year. Monday, bids showed up in defense of that support. This occurred again on Wednesday when at one point in time the S&P 500 was down 1.9 percent but only to crawl its way back up to end the session up 0.1 percent. Bulls are not in a mood to give up this support that easy. From Monday’s low through Thursday’s high, the index already rallied 4.1 percent, although resistance at the 50-day (2936.45) held. Bulls need to defend 2900.
At least until Wednesday, there were massive outflows, and this needs to change for bulls to continue momentum. In the week through Wednesday, SPY (SPDR S&P 500 ETF), VOO (Vanguard S&P 500 ETF) and IVV (iShares Core S&P 500 ETF) lost a combined $8.8 billion (courtesy of ETF.com). In the same week, $25.2 billion left US-based equity funds (courtesy of Lipper). This was the highest weekly loss since $34.6 billion was withdrawn in the week through December 19 last year – a week before stocks put in important lows.
Euro: Currently net short 44k, down 10k.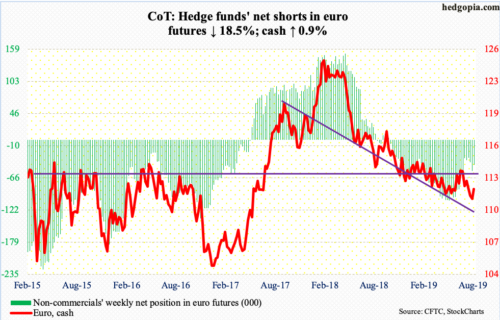
The cash ($112.03) opened the week with a rally past broken-support-turned-resistance at $111, then struggled at the 50-day ($112.40). Should euro bulls succeed in taking out the average, resistance is stiff at $113, which is where the 200-day lies as well. The daily is beginning to get extended.
Gold: Currently net long 292.5k, up 38.2k.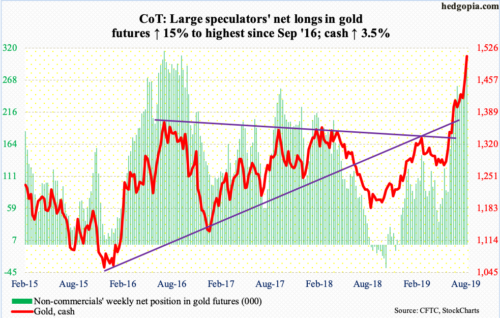
Gold continued to glitter this week, and flows continued to pour in. In the week to Wednesday, GLD (SPDR Gold ETF) took in another $1 billion – its 12th straight positive week. In the prior 11, it pulled in $4 billion. In the week to Wednesday, IAU (iShares Gold Trust) gained $143 million – its 7th positive week in eight (courtesy of ETF.com).
In the meantime, non-commercials’ net longs surged to a nearly three-year high.
For the week, the cash ($1,508.50/ounce) rallied another 3.5 percent. Wednesday’s intraday high of $1,522.70 was the highest since April 2013. On its way here, gold staged two breakouts, the first out of $1,350s-60s mid-June and out of $1,440s-50s last Friday. This Thursday, a daily spinning top showed up. The daily is overbought. In the event of a pullback, gold bugs for sure will try to defend shorter-term averages, not to mention $1,440s-50s.
Nasdaq 100 index (mini): Currently net long 39k, up 14.1k.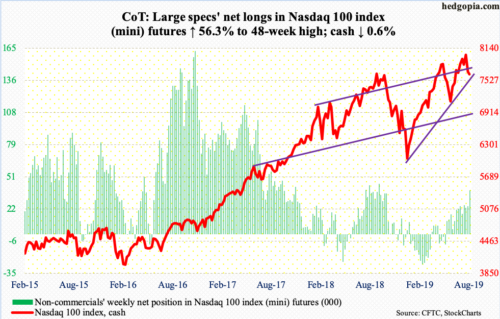
From down 4.4 percent intraday Monday to down 0.6 percent, the cash (7646.27) staged quite a reversal this week. The 50-day (7686.74) was lost, recaptured and then lost again. This was also true with 7700.
Earlier in the week, bulls stepped up where they needed to. In the midst of a stiff selloff Monday, bids showed up at a rising trend line from last December’s lows. Should they succeed in taking out the 50-day/7700, next resistance lies at 7850s. Bulls hope flows improve. In the week through Wednesday, QQQ (Invesco QQQ Trust) lost $2.7 billion (courtesy of ETF.com).
Russell 2000 mini-index: Currently net short 79.4k, down 975.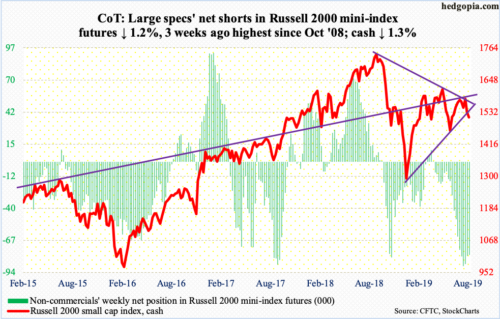
Monday, the cash (1513.04) sliced through not only the 200-day but also trend-line support from last December lows. Thursday’s 2.1-percent rally was not enough to recapture the broken trend line, ending the session right on it. Bears showed up where they could potentially have. Recapturing of this resistance opens the door to a test of the 50-day (1541.32) and 1570s after that. The latter is where resistance from a falling trend line from last August’s all-time high lies. But until then, it is bears’ ball to lose.
In the sessions ahead, a lot will depend on how flows behave. In the week ended Wednesday, IWM (iShares Russell 2000 ETF) and IJR (iShares Core S&P Small-Cap ETF) lost $168 million and $1.9 billion respectively (courtesy of ETF.com).
US Dollar Index: Currently net long 31.3k, up 1k.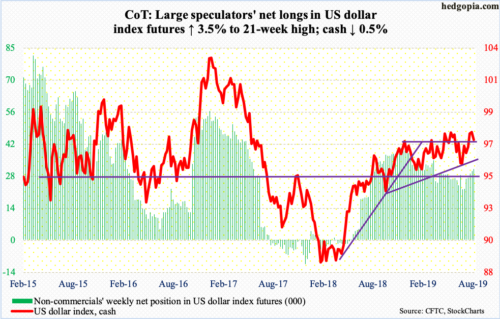
The cash (97.32) rallied to a 27-month high of 98.70 last week, when a weekly shooting star formed. The drop since found support Tuesday this week just above the 50-day (96.89). Bulls need to defend 97.50s. Else, odds favor a test of moving averages, with the 200-day at 96.65. Around 96.50 also lies rising trend-line support from last September.
VIX: Currently net short 80.6k, down 63.7k.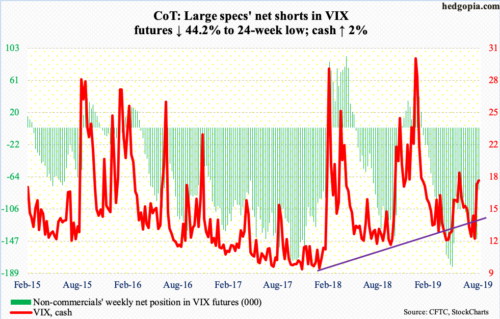
Monday’s intraday high of 24.81 was the highest since early January this year. Eight sessions before that, the cash (17.97) touched 11.69 intraday. Monday, the daily RSI jumped to just under 80. This is way overbought. The VIX-to-VXV ratio rose as high as 1.12 in that session, which once again is well into overbought territory. All this needed to unwind. The 200-day on VIX lies at 17.17 and the 50-day at 15.26. The latter also approximates horizontal support.
On a related note, the CBOE equity-only put-to-call ratio ended the week at 0.68, up from 0.598 on July 17. Unwinding can begin from high 0.60s-low 0.70s. On June 5, the ratio peaked at 0.706; stocks rallied in all of June and most of July.
Thanks for reading!
