
Following futures positions of non-commercials are as of April 14, 2020.
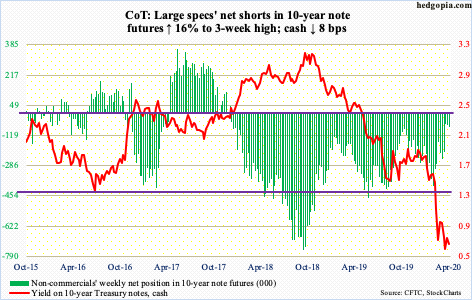
10-year note: Currently net short 70.8k, up 9.8k.
The Fed is on a mission to provide a backstop to a whole host of assets. Here is its report card to date.
On March 15th, it ventured into investment-grade corporate bonds. This was a Sunday. On the Friday before that, LQD (iShares iBoxx investment grade corporate bond ETF) closed at $123.05. This week, it closed at $130.56, down a percent for the week.
Thursday last week, the Fed announced up to $2.3 trillion in loans to support municipal and junk debt. HYG (iShares iBoxx high yield corporate bond ETF) closed at $77.30 that Wednesday, surging to $84.05 intraday Thursday. This week, it closed at $81.09, down 1.5 percent for the week. Similarly, MUB (iShares national muni bond ETF) closed last Wednesday at $112.33. It closed this week at $113.51, up 0.3 percent for the week.
Lipper data show that in the week to Wednesday $5.8 billion moved into investment-grade corporate funds and $7.7 billion into high-yield funds. In the meantime, as of Wednesday, the Fed took its balance sheet to $6.4 trillion, up $284.7 billion week-over-week and up $2.2 trillion since late February!
Through all this, the Fed wants higher equity prices, where it has succeeded, and for investors to take on risk and go up the risk curve, where the record is spotty at best. Small-caps, which investors tend to aggressively gravitate toward in a risk-on environment, are yet to outperform their large-cap brethren; this week, the Russel 2000 fell 1.4 percent, versus up three percent for the S&P 500 and up 7.2 percent for the Nasdaq 100.
Then, there is gold, which is one of the go-to assets for risk-averse investors (more on this here). Tuesday’s intraday high of $1,788.80/ounce touched a seven-and-a-half-year high.
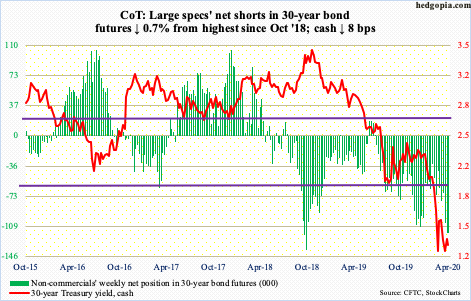
30-year bond: Currently net short 116.7k, down 777.
Major economic releases next week are as follows.
Existing home sales (March) are scheduled for Tuesday. Sales increased 6.5 percent month-over-month in February to a seasonally adjusted annual rate of 5.77 million units – a 13-year high.
New home sales (March) come out Thursday. February sales fell 4.4 percent from January’s 800,000 units, which was the highest since May 2007.
Friday brings durable goods orders (March) and the University of Michigan’s consumer sentiment index (April, final).
In the 12 months to February, orders for non-defense capital goods ex-aircraft – proxy for business capex plans – dropped 0.6 percent to $68.8 billion (SAAR). Orders peaked at $70 billion in July 2018.
Preliminarily, consumer sentiment crashed 18.1 points m/m in April to 70.1 – the lowest since December 2011.
WTI crude oil: Currently net long 676.8k, up 34.1k.
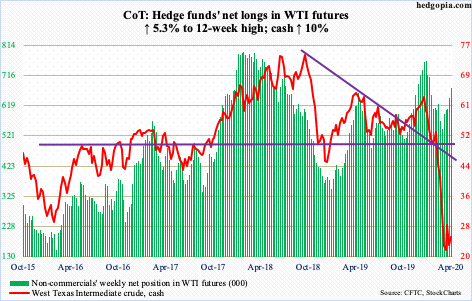
On March 30th, the cash ($25.03/barrel) dropped to $19.27 intraday, which was the lowest since February 2002. Sunday, OPEC+, which consists of OPEC and other oil-producing countries including Russia, reached a deal to slash output by 9.7 million barrels/day. Monday, the crude tried to rally on that but closed down 1.5 percent to $22.41. One trading session earlier, it had reversed after tagging $28.36 intraday.
Fundamentally, traders knew that the coronavirus-spurred demand destruction was much more than the agreed-upon cut. Technically, the March 30th low was tested Wednesday – as a matter of fact, was undercut by $0.07 – and that was bought.
As oversold as the crude is, there is decent resistance at $27-28, which is holding. But, encouragingly for bulls, shorter-term moving averages have consolidated enough, with a 10-20 crossover this week. For momentum to build, $27-28 needs to fall.
In the meantime, stocks of crude, gasoline and distillates continued to swell in the U.S. In the week to April 10, EIA data show, they respectively stood at 503.6 million barrels, 262.2 million barrels and 129 million barrels, up 19.2 million barrels, 4.9 million barrels and 6.3 million barrels. Refinery utilization continued to drop, down 6.5 percentage points to 69.1 percent. Crude production, however, fell 100,000 b/d, but at 12.3 mb/d the U.S. remains the leading global producer. Crude imports fell 194,000 b/d to 5.7 mb/d.
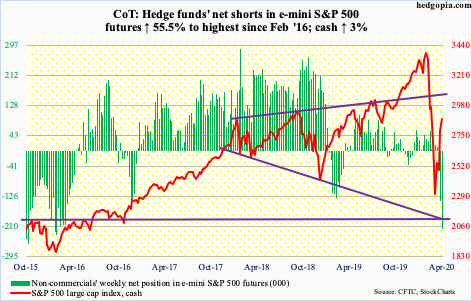
E-mini S&P 500: Currently net short 217.8k, up 77.8k.
In the week to Wednesday, SPY (SPDR S&P 500 ETF), VOO (Vanguard S&P 500 ETF) and IVV (iShares Core S&P 500 ETF) collectively lost $3.9 billion (courtesy of ETF.com). In the prior week, they took in $7.9 billion.
Stocks continue to push higher, yet money-market assets continue to swell. The S&P 500 bottomed on March 23rd, which was a Monday. In the week ended that Wednesday, money-market funds totaled $4.2 trillion. This week, they jumped $49.1 billion w/w to $4.5 trillion (courtesy of ICI).
To be fair, March witnessed indiscriminate selling. Flows came out of all kinds of assets from stocks to bonds to investment-grade to high-yield to municipal bonds. Hence the build-up in the so-called cash-on-the-sidelines. That said, even after the March 23rd low, not much has moved into equities – $5 billion this week and $12 billion in the couple of weeks before that (courtesy of Lipper).
For the last several sessions, bulls have been hammering on 2800-2850. Friday, the cash (2874.56) edged past that, not to mention the 50-day at 2863.09. At least until Tuesday, non-commercials were not seriously buying the recent strength, as their net shorts reached the highest since February 2016. A short squeeze is possible should bulls build on Friday’s action. Thus far, there are no reversal signs. Right above at 2935 lies 61.8-percent retracement of the February 19th-March 23rd collapse. Fibonacci followers pay close attention to this sequence, also known as the golden ratio, hence worth a watch.
Euro: Currently net long 86.6k, up 7k.
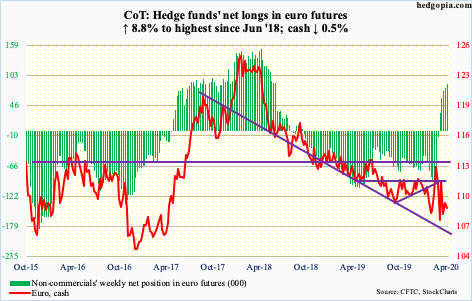
Yo-yo price action continues. Astute traders must be cherishing this volatility. Otherwise, it is not easy trading the euro – or any other major currency, for that matter.
The cash ($108.79) rallied to just slightly past the 50-day ($109.65) Tuesday but could not hold on to it. Over the past couple of months, $107.80s has been defended a few times, and likely gets tested again near term.
Gold: Currently net long 252.5k, up 3.6k.
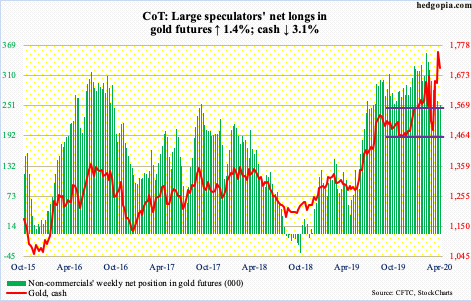
Risk-averse investors continue to gravitate toward gold-focused ETFs, with IAU (iShares Gold Trust) and GLD (SPDR Gold ETF) gaining $581 million and $1.8 billion in the week to Wednesday (courtesy of ETF.com). This brings four-week cumulative total to $6.5 billion.
Tuesday, the cash ($1,698.80/ounce) tagged $1,788.80, which was the highest since October 2012, before pulling back. The metal has come a long way, having dropped to $1,450.90 intraday on March 16th, hence remains extended. Last week, it broke out of $1,700, which is worth watching near term for direction of near-term momentum.
Nasdaq 100 index (mini): Currently net long 249, down 13.8k.
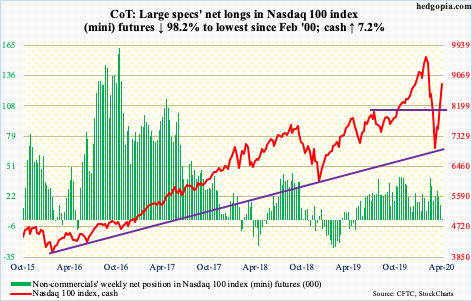
Tech is back in vogue – sort of. Amazon (AMZN) this week broke out of $2180s, as did Netflix (NFLX) out of $390s – to new highs. They respectively closed out the week at $2,375 and $422.96. The cash (8832.41) is now back above both its 50- and 200-day.
The problem is that the rally is excessively top-heavy, with the top five – Apple (AAPL), AMZN, Microsoft (MSFT), Alphabet (GOOG/L) and Facebook (FB) accounting for most of the advance. Their combined share in the S&P 500 is north of 21 percent! If past is prelude, in the big scheme of things, this is not sustainable.
Russell 2000 mini-index: Currently net short 24.1k, up 13k.
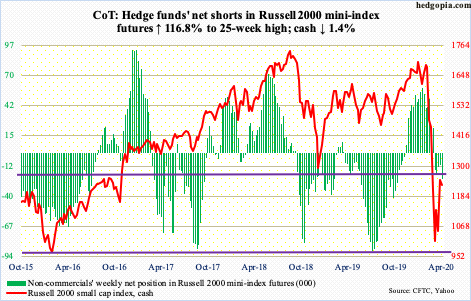
The cash (1229.10) retreated after getting rejected at 1250s twice in the last six sessions. This resistance goes back five years. Plus, at 1246 lies 38.2-percent Fibonacci retracement of the February 20th-March 18th drop (more on this here).
From small-cap bulls’ perspective, the good thing is that near-term support at 1170s was defended Thursday. Friday, the Russell 2000 rallied 4.3 percent. But it remains below the aforementioned level. As things stand, unless a breakout occurs, it is bears’ ball to lose.
In the week to Wednesday, IWM (iShares Russell 2000 ETF) attracted $472 million and IJR (iShares Core S&P Small-Cap ETF) $61 million (courtesy of ETF.com). In the past four weeks, they respectively lost $207 million and $49 million.
US Dollar Index: Currently net long 15.4k, up 333.
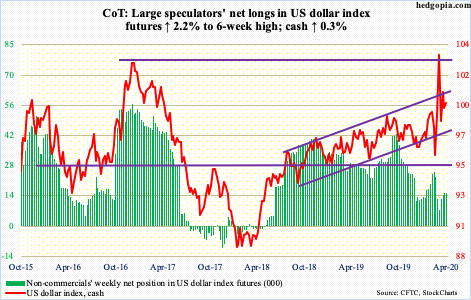
In the first three sessions this week, bulls defended the 50-day (99.19). Thursday’s intraday high of 100.39 tested five-year horizontal resistance. In March, in fact, the cash (99.84) broke out of this, but only to get denied at the January 2017 high just south of 104. Should a breakout occur and should it stick, repercussions will be felt across all kinds of assets and currencies, not to mention economies, particularly emerging.
VIX: Currently net short 33.5k, up 2.9k.
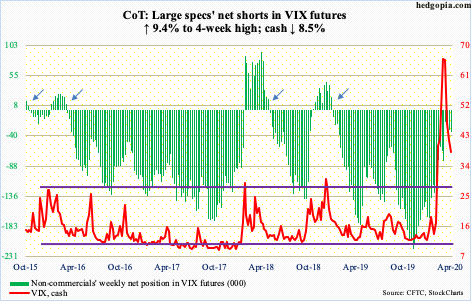
For several sessions prior to Friday, volatility bulls and bears were in a wait-and-see mode as the cash (38.15) straddled the 50-day (42.48). Friday, the average was lost. All this unfolded just above the March 24th intraday low of 36.24, which itself was a successful test of the December 2018 high of 36.20. A decisive loss of this support likely means VIX in due course wants to go test support at mid- to high-20s, but until that happens, risk is to the upside. The daily could very well be itching to move up.
Thanks for reading!
