Following futures positions of non-commercials are as of May 19, 2020.
10-year note: Currently net short 93.1k, down 58.4k.
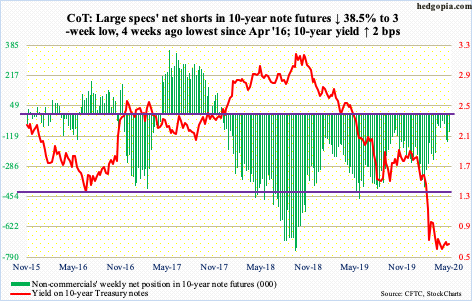
This data is a little outdated, but foreigners were big sellers of Treasury securities in March. On a net basis, they sold $299.3 billion worth in notes and bonds, for a 12-month total of minus $388.9 billion. This is record territory. The 10-year Treasury yield (0.66 percent), however, dropped 43 basis points in March to 0.70 percent, dropping at one time to as low as 0.40 percent.
March was a month in which until the 23rd US stocks were in a free fall. Investors were seeking the safety of US sovereign debt. Besides, the Fed increased its holdings of Treasury notes and bonds by nearly $750 billion in that month, which more than offset the foreign selling. The central bank continues to expand its balance sheet, but at a decelerating pace. In April and May-to-date, holdings of Treasury notes and bonds went up by $680 billion, to $3.46 trillion.
The central bank wants lower rates. With national debt north of $25 trillion – and counting – and federal budget deficit through the roof, the Fed cannot afford rising rates. But, unless March was an anomaly, continued selling by foreigners can cause a problem in interest rate dynamics. As of March, they owned $6.8 trillion in Treasury securities, down from $7.1 trillion in February.
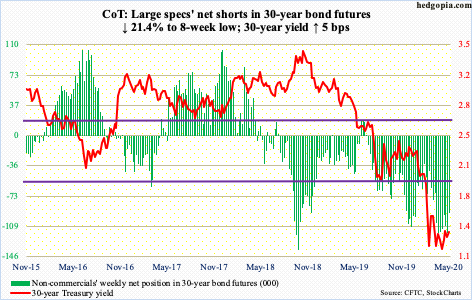
30-year bond: Currently net short 92.9k, down 25.3k.
Major economic releases next week are as follows. Markets are closed Monday for observance of Memorial Day.
The S&P Case-Shiller home price index (March) and new home sales (April) are on tap Tuesday.
Nationally, home prices increased 4.2 percent year-over-year in February. This was the fastest pace of price appreciation in 13 months.
New home sales dropped 15.4 percent month-over-month in March to a seasonally adjusted annual rate of 627,000 units. Sales are down 19.3 percent from January’s 777,000 units, which was the highest since July 2007.
GDP (1Q20, second estimate), corporate profits (1Q20, preliminary) and durable goods orders (April) are scheduled for Thursday.
The advance estimate showed real GDP declined at an annual rate of 4.8 percent in 1Q20 – first contraction in six years.
Corporate profits adjusted for inventory and capital consumption in 4Q19 grew 2.2 percent y/y to $2.13 trillion. The all-time high $2.19 trillion was recorded in 3Q14.
March orders for non-defense capital goods ex-aircraft – proxy for business capex plans – dropped 2.2 percent y/y to $65.9 billion (SAAR).
Friday brings personal income/spending (April) and the University of Michigan’s consumer sentiment index (May, final).
In the 12 months to March, core PCE, which is the Fed’s favorite measure of consumer inflation, rose 1.7 percent. This was the 18th consecutive sub-two percent reading.
Preliminarily, consumer sentiment in May increased 1.9 points m/m to 73.7. April’s 71.8 was the lowest since December 2011.
WTI crude oil: Currently net long 701.6k, up 12.3k.
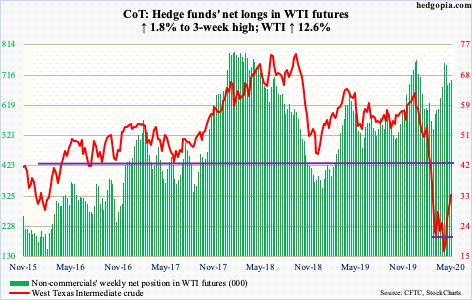
After tagging $6.50 intraday on April 21st, WTI ($33.25/barrel) has now rallied for four straight weeks. This week, it jumped 12.6 percent, with Thursday’s high of $34.66 testing the gap-down resistance from early March. The gap gets filled just north of $41.
The crude has come a long way in the last four weeks and is very extended on the daily. There is room for continued rally on the weekly, but several indicators including the RSI are approaching the median. This is a good place for bears to potentially show up.
Friday, WTI dropped as low as $30.72 but the weakness was bought to end with a hanging man. This formation is potentially bearish. In the event the crude comes under pressure near term, there is support at $27-28, followed by the 50-day ($23.56), which is now flattish.
In the meantime, as per the EIA, US crude production continued lower, down another 100,000 barrels per day to 11.5 million b/d in the week to May 15th. Production peaked in February/March at 13.1 mb/d. Crude imports and stocks fell as well – down 194,000 b/d and five million barrels respectively to 5.2 mb/d and 526.5 million barrels. Refinery utilization inched up 1.5 percentage points to 69.4 percent. Stocks of gasoline and distillates, however, rose – up 2.8 million barrels and 3.8 million barrels to 255.7 million barrels and 158.8 million barrels, in that order.
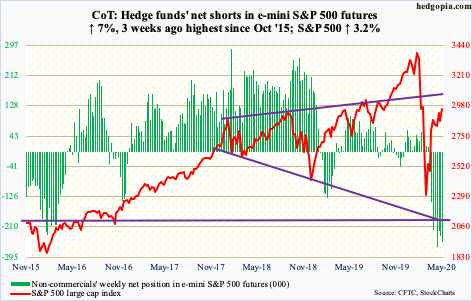
E-mini S&P 500: Currently net short 252.9k, up 16.6k.
The S&P 500 bottomed on March 23rd. From the week ended March 25th through this Wednesday, $38.2 billion left US-based equity funds, including this week’s $4.9 billion (courtesy of Lipper). Similarly, from March 23rd to May 20th, SPY (SPDR S&P 500 ETF), VOO (Vanguard S&P 500 ETF) and IVV (iShares Core S&P 500 ETF) collectively lost $13.3 billion, including this week’s 4.6 billion. Using this metric, the massive rally from the March low is being used as an opportunity to lighten up exposure to stocks – just shows how different things might be if the Fed did not intervene.
This week, after defending 2760s last Thursday right at the daily lower Bollinger band, bulls continued to press, with a gap higher Monday right into the upper band (more on this here). This also marks the upper end of the recent trading range. After rallying 3.2 percent for the week, the S&P 500 (2955.45) closed right on that ceiling. A breakout has the potential to take out stops and squeeze shorts, particularly if the 200-day at 2999.72 gives way. Non-commercials are staying with their massive net shorts. That said, being able to sustain the momentum is a different matter altogether. At the end of the day, flows need to cooperate. And, news has not been positive on that front.
Euro: Currently net long 72.6k, down 5.6k.
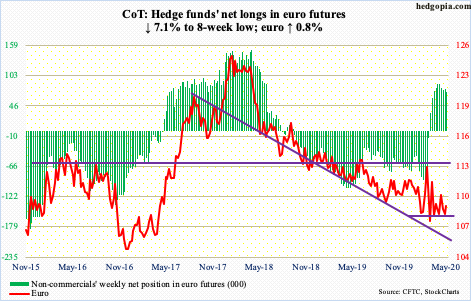
Euro bulls built on last Thursday’s defense of straight-line support at $107.70s, which goes back three months. The currency ($109.01) not only reclaimed the 50-day ($108.91) but also just about tested the 200-day at $110.20. Thursday’s high of $110.10 was rejected at horizontal resistance at $110, ending the week right inside a two-month pennant. By Friday, the 50-day was tested again. Choppy action continues.
Gold: Currently net long 251.8k, up 9k.
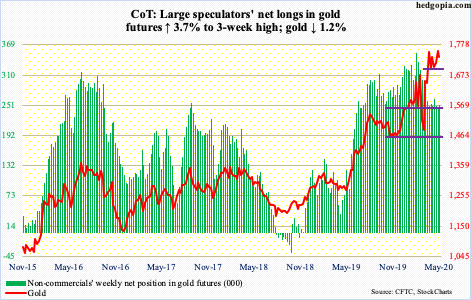
Monday, gold ($1,735.50/ounce) went after the April 14th high of $1,788.80 but retreated after tagging $1,775.80. The metal has been caught in a sideways pattern above $1,700, or just under, since early March. ETF flows continue to be positive, even as non-commercials have been paring back their net longs.
In the week to Wednesday, GLD (SPDR Gold ETF) and IAU (iShares Gold Trust) respectively took in $1.1 billion and $391 million. This was the ninth straight week of positive flows, during which $13.1 billion cumulatively came in (courtesy of ETF.com). That is a lot. Non-commercials, on the other hand, were net long 353,649 contracts in gold futures in the week to February 18th, versus 251,788 this week.
The advantage gold bugs have is that for a month now $1,700, or just below, has continued to attract bids. Unless non-commercials begin to bail out in droves, this likely continues, with additional support of the daily lower Bollinger band at $1,683.73 and the 50-day at $1,676.02. Both the 50- and 200-day are still rising.
Nasdaq 100 index (mini): Currently net short 5k, up 13.4k.
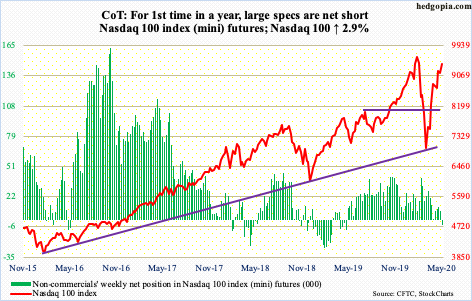
At Thursday’s high of 9515.05, the Nasdaq 100 was merely 2.3 percent from its record high from February 19th. Tech bulls are just killing it. From the March 23rd low of 6771.91, the index (9413.99) surged 40.5 percent!
Flows into QQQ (Invesco QQQ Trust) have been positive for five straight weeks, for a total haul of $5.5 billion, including $1.1 billion in the week to Wednesday this week (courtesy of ETF.com).
Even after this move, the daily RSI is yet to reach 70 on the Nasdaq 100. Thursday, it crossed 65 before retreating, with Friday at 62.5. This could be viewed both positively and negatively, depending on one’s bias. If on the one hand this shows there is room for the indicator to get overbought, on the other the inability to already do so points to underlying weakness. Most of the action is in large-caps, such as Amazon (AMZN), Apple (AAPL) and Microsoft (MSFT).
The gap from February has been filled, and this can tempt shorts to stick their toe in. For the first time in a year, non-commercials are now net short. With all that said, the 10- and 20-day – respectively at 9256.60 and 9092.72 – are still rising. Bears need to reclaim these averages before getting traction. Nearest support lies at 8900.
Russell 2000 mini-index: Currently net long 6.2k, up 24.5k.
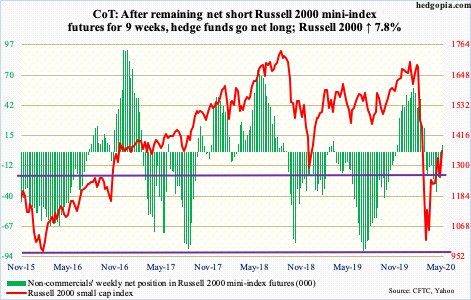
The Russell 2000 rallied 7.8 percent this week, following a 5.5 percent rally last week. There is nothing like price to change sentiment. In the week through Wednesday, $343 million came out of IJR (iShares Core S&P Small-Cap ETF) but $2.6 billion moved into IWM (iShares Russell 2000 ETF). This was the largest weekly flows into IWM since mid-September last year.
This follows defense last Thursday of 1170s. The rally since was enough to reclaim 1250s and test – once again – 1330s, wherein lies the 50 percent retracement of the February-March collapse. In fact, toward the end of April, the Russell 2000 (1355.53) rallied to 1373.39 but staying there proved difficult. Just under 1400 lies gap-down resistance from March 9th.
Despite the sideways action and investor unwillingness to aggressively take on risk (more on this here), some level of fatigue is in the air, with a a doji just above 1330s on Thursday. At the same time, both Thursday and Friday, there were bids waiting at 1330s. Inability to save this level exposes small-cap bulls to a test of 1250s where they can try to regroup.
US Dollar Index: Currently net long 17.3k, up 847.
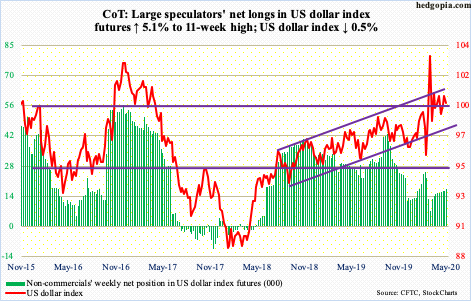
Monday was the latest dollar bulls were rejected at five-year horizontal resistance at 100.50-101. The drop since cost the US dollar index (99.59) the 50-day (100.10). By Wednesday, it tested the daily lower Bollinger band – successfully. But the key roadblock remains the resistance in question. After that, just north of 101 lies the upper bound of an ascending channel going back to August 2018.
VIX: Currently net short 35k, down 4.7k.
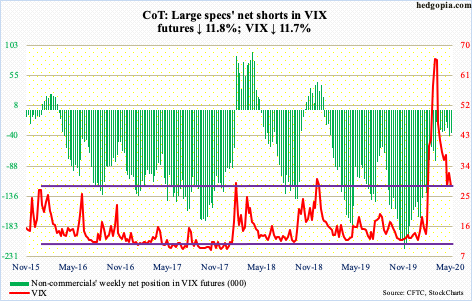
In the first four sessions this week, VIX (28.16) trended lower all along the 10-day. Volatility bulls tried to recapture the average intraday Friday but only to get denied at the 20-day, closing the session in the red.
From volatility bulls’ perspective, Thursday’s low of 27.67 came in higher than last week’s low of 26. This is positive, but it increasingly feels like VIX for now wants to go test the lower end of mid- to-high-20s support. The 200-day lies at 24.18.
In the meantime, the CBOE equity-only put-to-call ratio is beginning to convey growing investor optimism – even froth. The 21-day moving average ended the week at 0.588, down from 0.867 on March 20th. Historically, mid- to high-0.50 readings signal greed is taking over. The 10-day average ended the week at 0.557. If past is prelude, this is the time to get out the caution hat.
Thanks for reading!

