
Following futures positions of non-commercials are as of February 9, 2021.
10-year note: Currently net long 79.5k, up 20.9k.
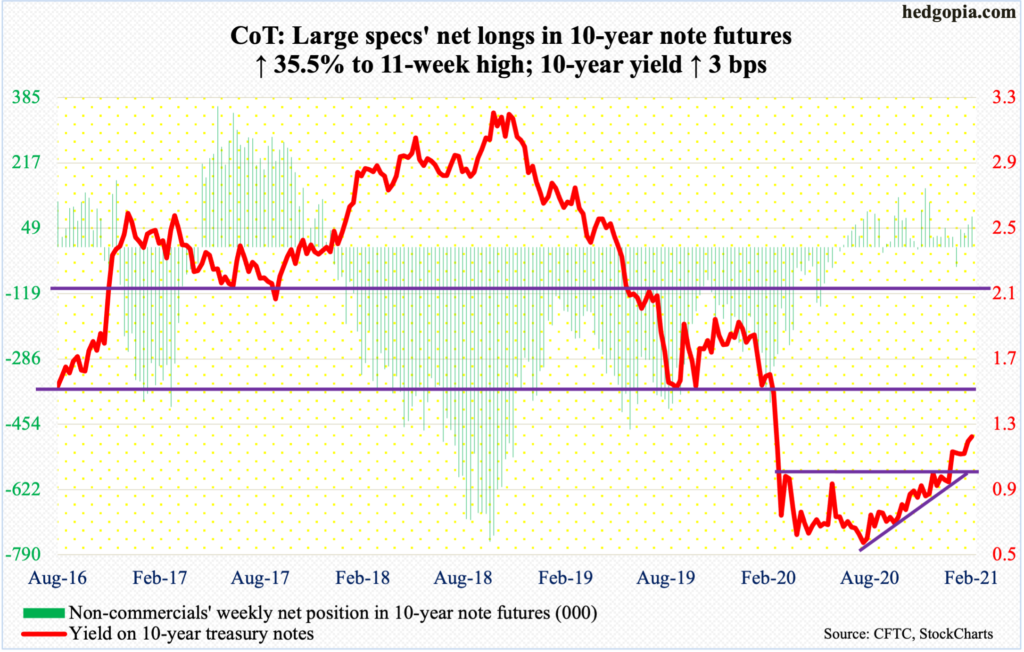
Minutes for the January 26-27 FOMC meeting – the first of eight scheduled meetings this year – will be out Wednesday. Markets are hardly on pins and needles; they do not expect the unexpected.
On December 16 last year, at the end of a two-day FOMC meeting, Chair Jerome Powell made it clear the Fed would buy $120 billion/month in mortgage-backed securities and treasury bonds. Then early last month, as soon as the 10-year treasury yield crossed one percent, several Fed officials, including Powell and Vice Chair Richard Clarida, tried to jawbone the bond market saying they would continue to aggressively purchase these bonds. On Wednesday (this week), Powell played down inflation worries, emphasizing policymakers should instead focus on restoring maximum employment.
The message is clear. The Fed wants to continue to expand its balance sheet – $7.44 trillion as of Wednesday, up from $4.24 trillion in the first week of last March – and rates will not be allowed to rise too much. Wednesday’s minutes will nothing but reiterate this message.
The problem is, rates are perking up, with the 10-year (1.2 percent) currently attempting to stage another mini breakout, which, if successful, will open the door toward 1.4 percent. Should things transpire this way, more interesting will be the Fed’s reaction function.
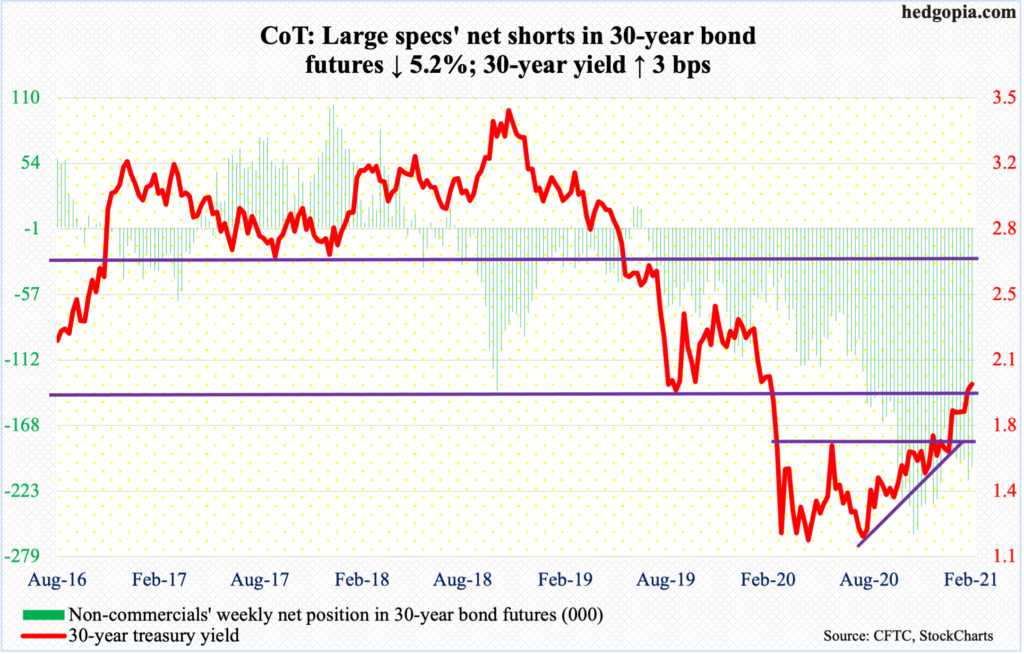
30-year bond: Currently net short 203.2k, down 11.2k.
Major economic releases for next week are as follows. Markets are closed Monday for observance of Presidents’ Day holiday.
The Treasury International Capital data (December) will be published on Tuesday. In the 12 months to November, foreigners’ purchases of US stocks reached a new high of $316.2 billion – quite a reversal from April 2019 when they sold record $214.6 billion worth.
Wednesday brings retail sales (January), industrial production (January) and the NAHB Home Price Index (February).
After rising to a new record high of $552.8 billion (seasonally adjusted annual rate) last September, retail sales weakened three months in a row to December’s $540.9 billion. Earlier in April, sales languished at $412.8 billion.
Capacity utilization in December rose 1.6 percent m/m to 74.5 percent – a 10-month high. Utilization dropped to 64.2 percent in April.
Homebuilder optimism declined three points m/m in January to 83. Last November’s record high 90 was three times April’s reading of 30.
Housing starts (January) are due out Thursday. December starts rose 5.8 percent m/m to 1.67 million units (SAAR). This was the highest since September 2006. Last April, starts were 934,000 units.
Existing home sales are scheduled for Friday. Sales increased 0.7 percent m/m in December to 6.76 million units (SAAR). Last May, sales were down to 3.91 million.
WTI crude oil: Currently net long 549.3k, up 13.5k.
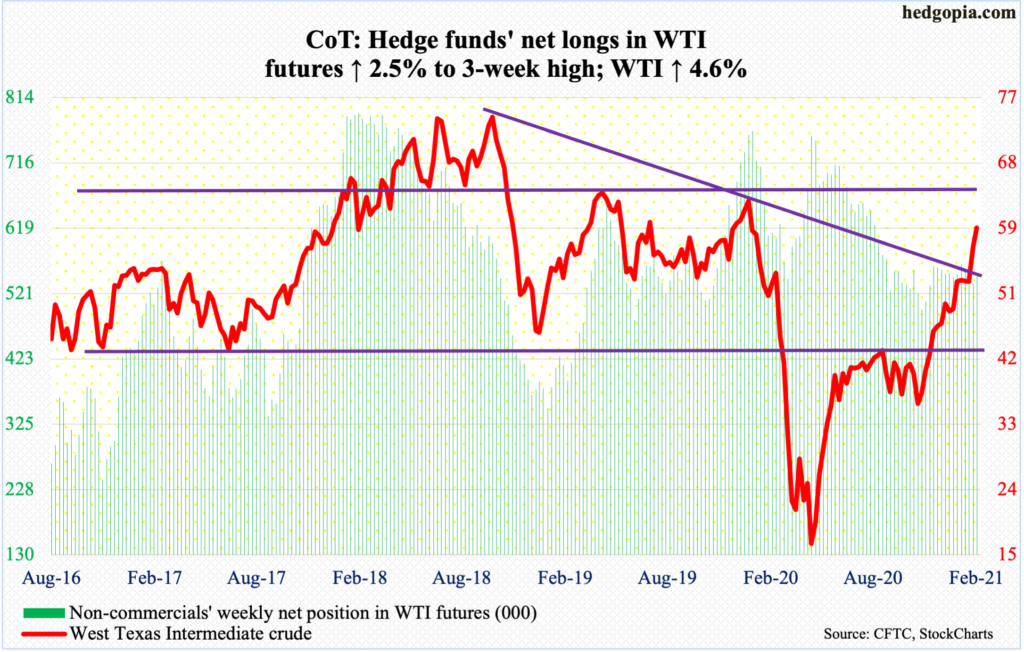
After reclaiming last week a falling trend line from October 2018 when it peaked at $76.90, WTI ($59.47/barrel) is currently testing another falling trend line of a longer duration. In July 2008, the crude posted record $147.27, a trend line from which gets tested around $60. WTI has rallied in nine out of last 10 sessions, tagging $59.81 intraday Friday.
The daily and weekly in particular remain grossly overbought, but upward momentum is intact. In the event of a pullback, shorter-term averages lie between $55-$57, followed by horizontal support at $53.40s, and $52.20s after that. The latter is significant as this was the level the crude traded around for three doji weeks before breaking out last week.
In the meantime, according to the EIA, US crude production in the week to Jan 5 rose 100,000 barrels per day to 11 million b/d. Gasoline stocks increased as well – up 4.3 million barrels to 256.4 million barrels. Refinery utilization inched up seven-tenths of a percentage point to 83 percent. Stocks of crude and distillates, however, declined 6.6 million barrels and 1.7 million barrels to 469 million barrels and 161.1 million barrels, in that order. Crude imports dropped 650,000 b/d to 5.9 mb/d.
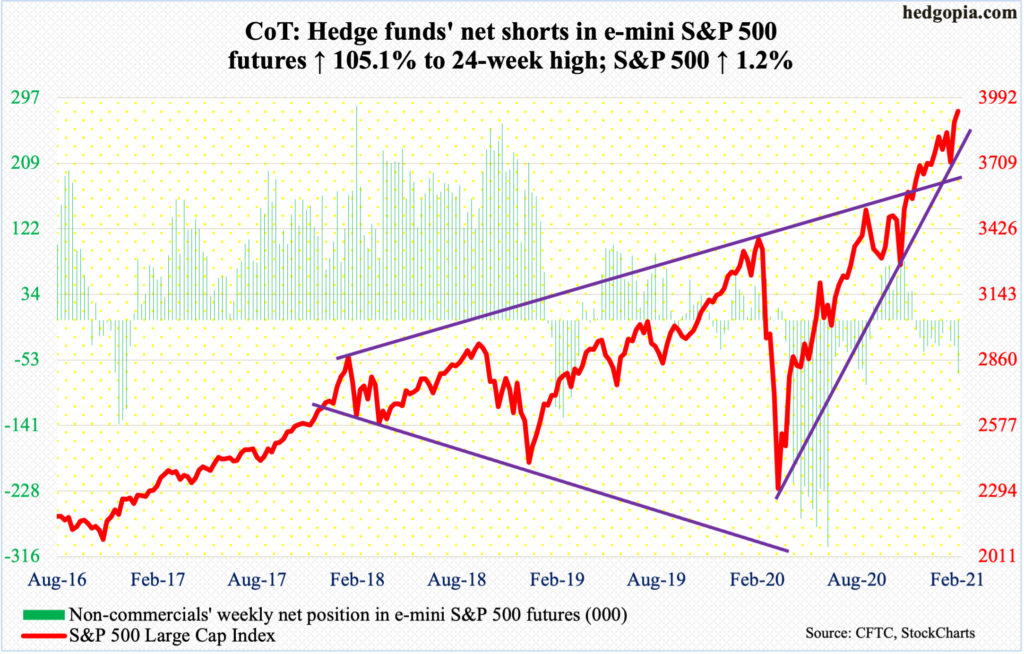
E-mini S&P 500: Currently net short 71.5k, up 36.6k.
Flows were in full cooperation. In the week to Wednesday, $25.9 billion moved into US-based equity funds (courtesy of Lipper). In the same week, SPY (SPDR S&P 500 ETF), VOO (Vanguard S&P 500 ETF) and IVV (iShares Core S&P 500 ETF) collectively took in $20.6 billion (courtesy of ETF.com). These are huge numbers. Bulls can only hope this continues. In the week to Wednesday, US money-market assets, which are widely viewed as cash on the sidelines, rose $6.2 billion week-over-week to $4.32 trillion and remain highly elevated. These funds have dropped since peaking at $4.79 trillion last May but are still higher than the $3.94 trillion they held in the week to March 18 last year; the S&P 500 put in a major low on the 23rd that month.
After surging 4.7 percent last week, the large cap index (3934.83) added another 1.2 percent this week, to a new high. Under the surface, however, action was tentative. Tuesday produced a doji, Wednesday a spinning top and Thursday a long-legged doji. At least a few other times in recent months, similar lethargy was seen, but when it was all said and done it turned out to be nothing more than a pause, before the upward trend reasserted itself.
For bears to get any traction here, they need to reclaim 3870s. Speaking of which, non-commercials raised their net shorts in e-mini S&P 500 futures to a 24-week high. This could turn out to be a good strategy medium term, provided they do not get squeezed near term.
Euro: Currently net long 140.2k, up 3.2k.
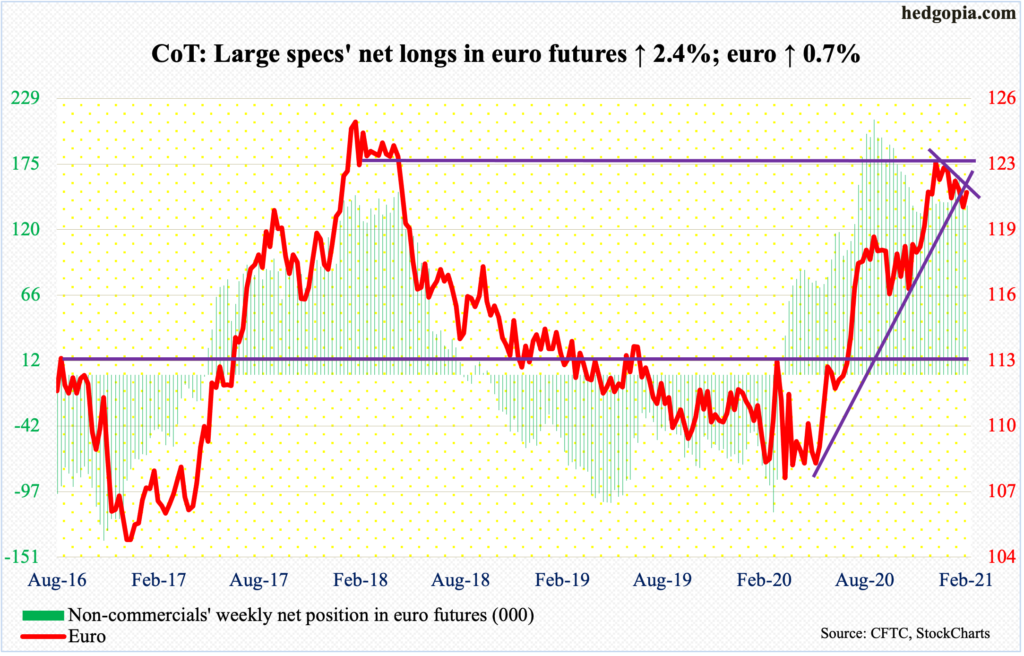
Euro bulls have a task at hand. Last Thursday, they put their foot down by saving $1.18-$1.19. Earlier on January 6, the euro ($1.2119) peaked at $1.2345.
After last Thursday’s intraday low of $1.1957, the currency rallied 0.6 percent this week. Thursday’s intraday high of $1.2150 tested dual resistance – the 50-day moving average ($1.2156) and straight-line resistance at $1.20-$1.21, which goes back more than 17 years and which the bulls reclaimed in early December. This also approximates the underside of a broken trend line from last May. Bulls have their work cut out.
Gold: Currently net long 251.4k, down 5.7k.
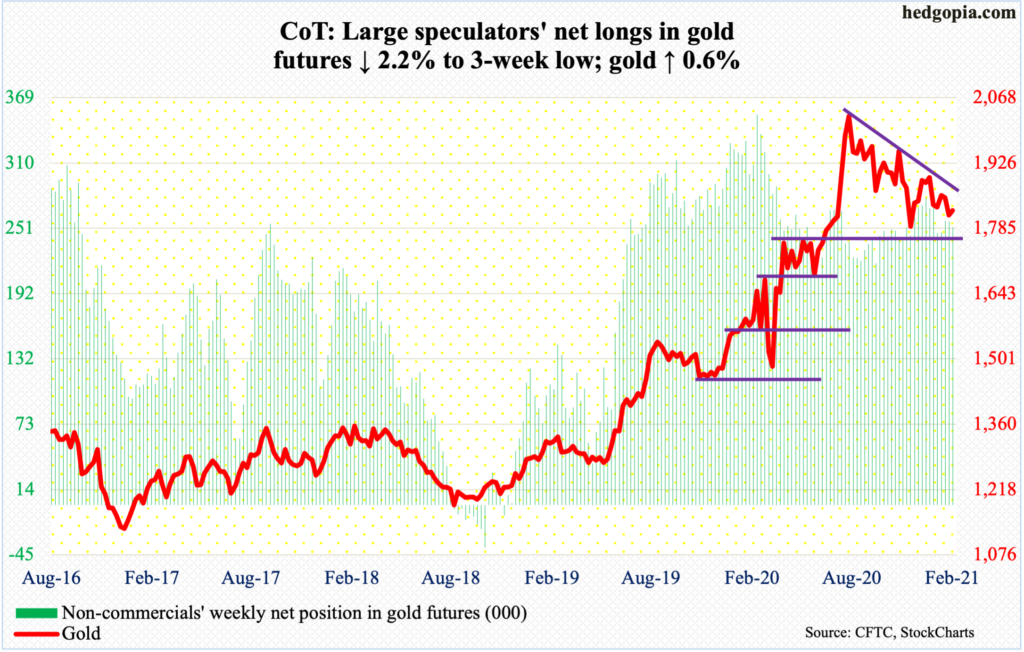
Last Thursday when gold ($1,823.20/ounce) dropped to $1,784.60 intraday, it just about tested crucial support at $1,760s-$1,770s. The metal reached its all-time high of $2,089.20 on August 7, and currently finds itself within a potentially bearish descending triangle, the lower support of which lies at $1,760s-$1,770s.
Four trading sessions after last Thursday’s low – that is Wednesday this week – the metal was rejected at horizontal resistance at $1,850s, which is about where both the 50- and 200-day ($1,858.52 and $1,857.03 respectively) reside; the daily RSI turned back down from the median in that session.
Inability to rally strongly off support continues to put gold bugs on the defensive. From their perspective, this raises the risk that $1,760s-$1,770s eventually gives way, which will complete the descending triangle pattern.
Nasdaq 100 index (mini): Currently net long 25.7k, down 3.4k.
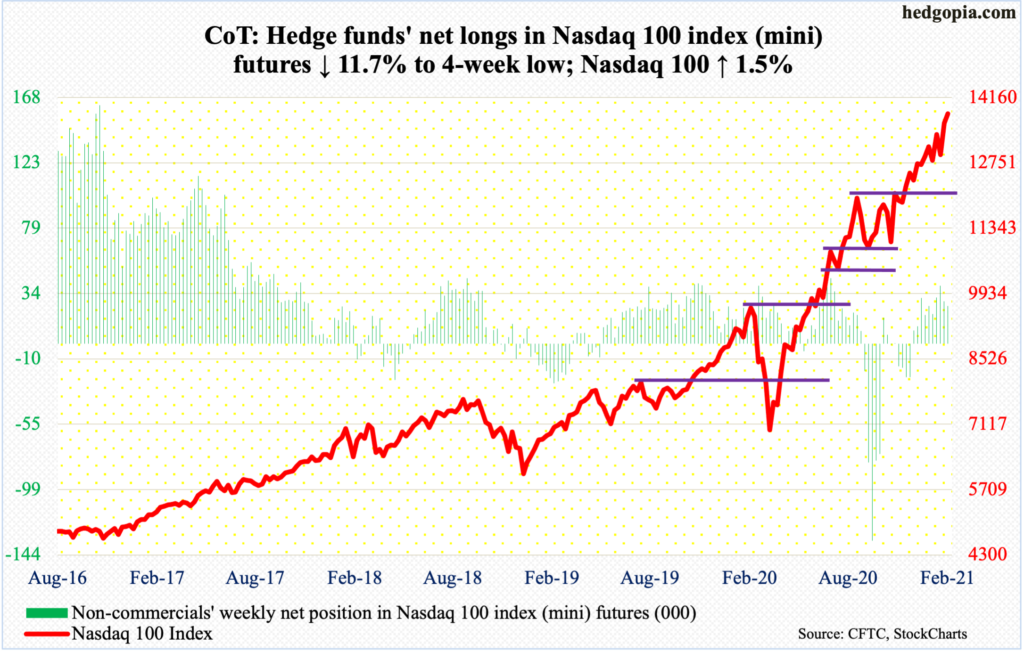
After January’s monthly long-legged doji, the Nasdaq 100 is up 6.8 percent so far this month. Bears once again were unable to make the most of opportunities that came their way. After peaking on January 25 at 13563.70, the index (13807.70) came under pressure, but the weakness only lasted four sessions.
As January came to an end, the tech-heavy index landed right on a rising trend line from last March, and bulls were not in a mood to let that go that easily. From their perspective, supports continue to attract bids, including Wednesday this week when short-term support at 13560s was defended, a loss of which could hasten a move toward the 50-day at 12979.91.
Russell 2000 mini-index: Currently net short 8.4k, up 10.3k.
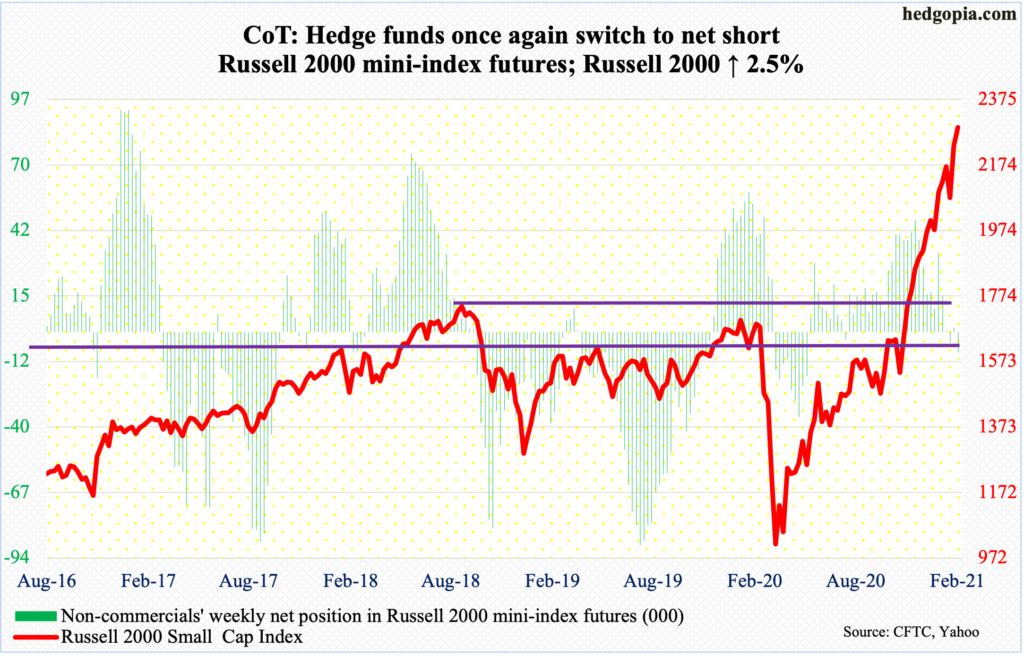
On both Wednesday and Thursday, the Russell 2000 was repelled at the upper bound of a rising channel from late October-early November. Earlier on January 29, which was the month’s last trading session, the small cap index landed right on the bottom end of the channel, which was vigorously defended (more on this here).
This is an opportunity for small-cap bears to push the Russell 2000 (2289.36) toward the lower end of the channel, which lies at 2150s and which also lines up with one-month straight-line support.
US Dollar Index: Currently net short 13.9k, down 955.
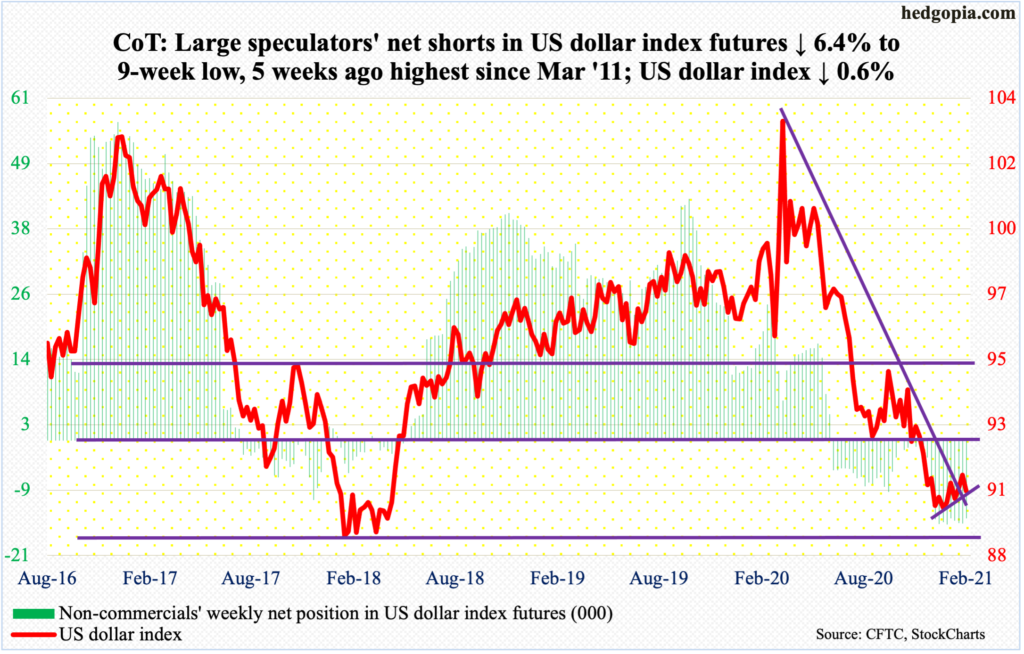
Last Friday’s intraday high of 91.61 is all dollar bulls could do to test broken-support-turned-resistance at 92, which has proven to be an important level going back to at least June 2003. This level was lost toward the end of last November.
After last week’s failed test of 92, bears showed up this week. A loss of 90 opens the door to a test of 88-89, which goes back to at least March 2004. Earlier on January 6, the index (90.47) bottomed at 89.17.
VIX: Currently net short 138.3k, up 21.8k.
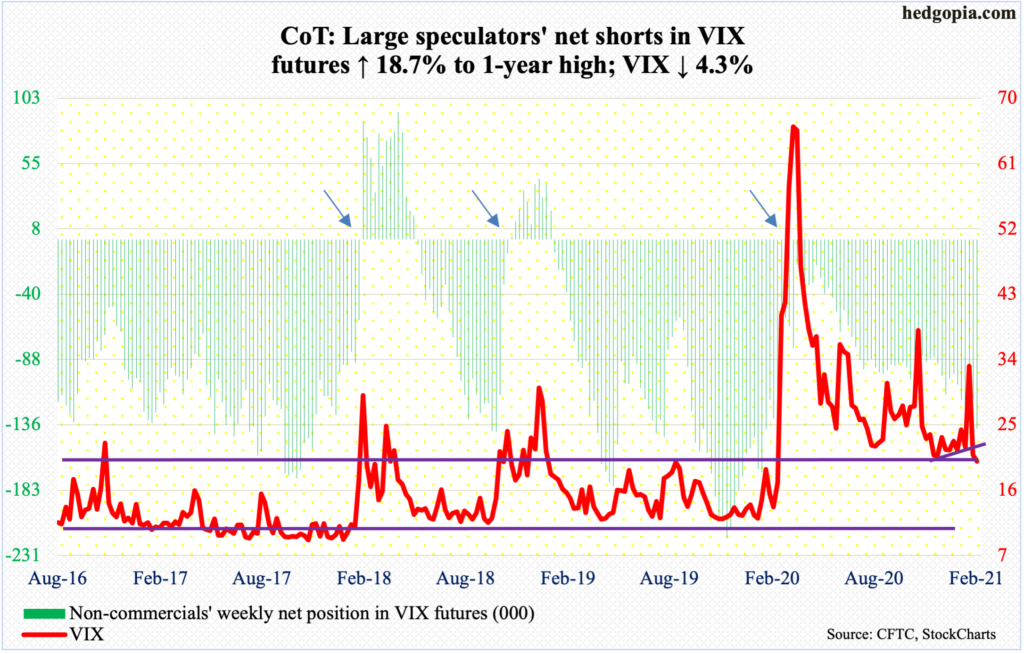
VIX (19.97) is clinging on to 20 and is on the verge of a breakdown (more on this here). This is an opportunity for volatility bears to push the index toward mid- to high-teens. Non-commercials are positioned accordingly, having built net shorts in VIX futures to a one-year high. Near-term notwithstanding, it is worth pointing out that VIX tends to peak after these traders are either net long or have substantially cut back their net shorts (arrows in the chart).
Thanks for reading!
